Figure 5.
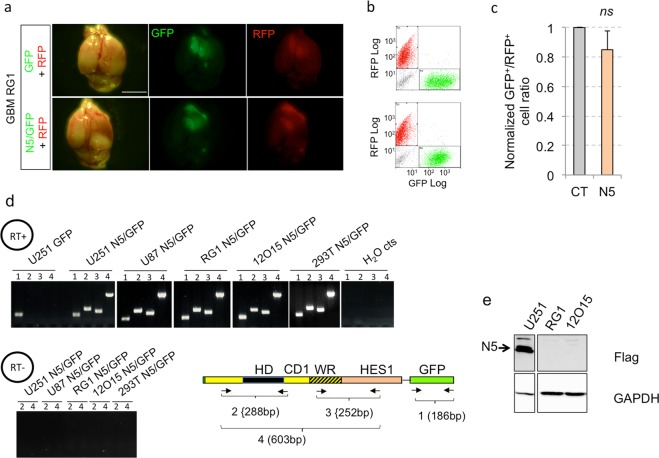
Absence of stable NANEP5 protein in two primary GBMs. (a) Representative images of dorsal views of dissected mouse brains after orthotopic xenotransplantation of primary RG1 GBM red and green cells (infected with GFP+ or RFP+ lentivectors as indicated on the left). Pictures show dorsal views and were taken under visible (left panels) and fluorescent light (GFP and RFP, middle and right panels, respectively). Scale bar = 4 mm for all panels. (b) FACS plots showing GFP+/RFP+ cells ratios after dissociation of whole RG1 brain tumors shown in the same rows in panel (a). (c) Quantification of GFP+/RFP+ cells ratios in RG1 tumors after whole tumor dissociation and FACS analysis. Ratios form control tumors were normalized to 1. Error bars are SEM. ns = not significative (p > 0.05). n = 4 grafts per condition. (d) Mapping transgene transcription. RT-PCR results shown were performed on RNA extracted from 5 different cell types (annotated above the pictures of agarose gels) infected with GFP-expressing empty lentivector as control (GFP) or GFP and NANEP5-expressing lentivectors (N5/GFP) using four different pairs of primers as noted in the box diagram. Negative controls (cts) include: control GFP+ infected U251 cells, H2O controls and reverse transcriptase negative (RT-) reactions (lower panel). Primers alignments within NANEP5 and GFP regions as well as the expected sizes of PCR products (1–4) are shown on the box diagram. Note that all NANEP5 regions are expressed in all NANEP5-transduced cell types. (e) Western blots showing the lack of NANEP5 (N5) protein expression in two primary GBMs (RG1 and 12O15), which contrasts to its clear expression in U251 cells (arrow). GAPDH was used as a loading control.

