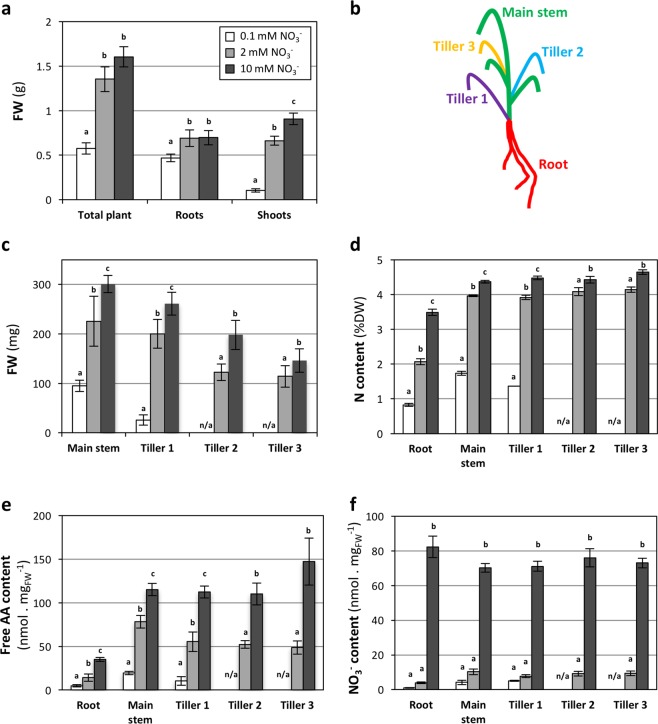
Figure 1.
Effects of NO3− availability at vegetative stage. Plants were grown on sand for 35 days, watered with nutritive solution containing 0.1, 2 or 10 mM NO3−. (a) Fresh weight of total plant, roots and shoots. (b) Schematics of tiller development. Tiller were numbered according to their sequential apparition. (c) Fresh weight, (d) N content, (e) Free AA content and (f) NO3− content of main stem and tillers. Values correspond to the mean of 4 or 5 biological replicates (2 plants each) +/−SD. Letters indicate statistical groups for each plant part (Non-parametric ANOVA, p < 0.05). N/a: no data available, due to the lack of development of tillers 2 and 3 in the 0.1 mM NO3− condition.

