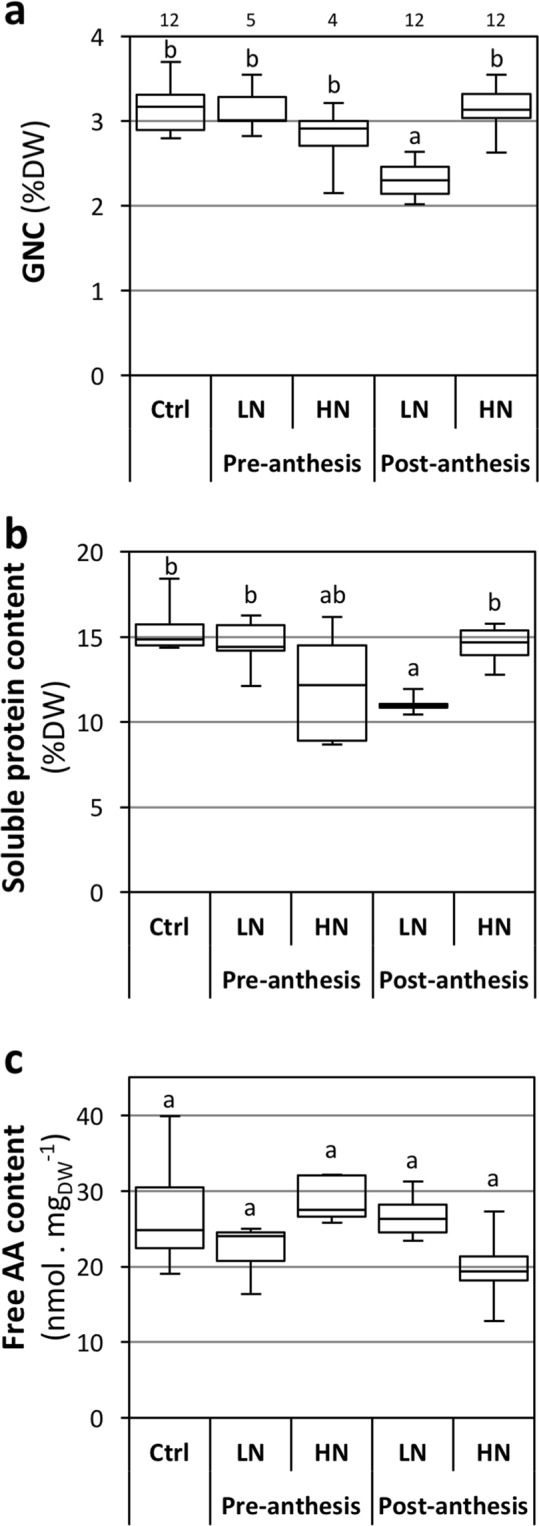
Figure 3.

Effects of pre- and post-anthesis NO3− availability on grain composition. Growing conditions and treatments were as described in Fig. 2. LN, Ctrl and HN: 0.1, 1 and 10 mM NO3−, respectively. Grain contents in (a) total N (GNC), (b) extractable proteins and (c) free AA. The boxplots represent minimum, 1st quartile, median, 3rd quartile and maximum values. Letters indicate statistical groups (Non-parametric ANOVA, p < 0.05). Number of biological replicates for N content are indicated above the chart; other charts are based on 5 biological replicates per condition.
