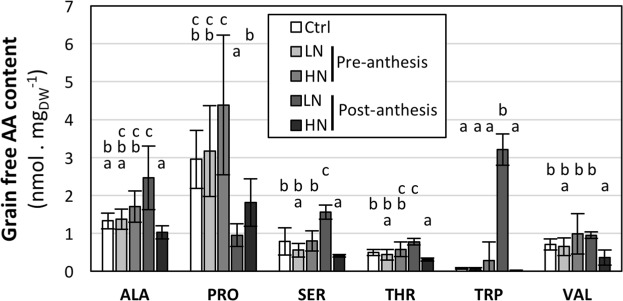
Figure 4.
Effects of pre- and post-anthesis NO3− availability on grain free AA composition. Growing conditions and treatments were as described in Fig. 2. LN, Ctrl and HN: 0.1, 1 and 10 mM NO3−, respectively. Only free AA levels affected by the treatments are presented; see Table S1 (Supplementary Information) for full set of data. Values are means of 5 biological replicates +/−SD. Letters indicate statistical groups for each AA (Non-parametric ANOVA, p < 0.05).

