Figure 3.
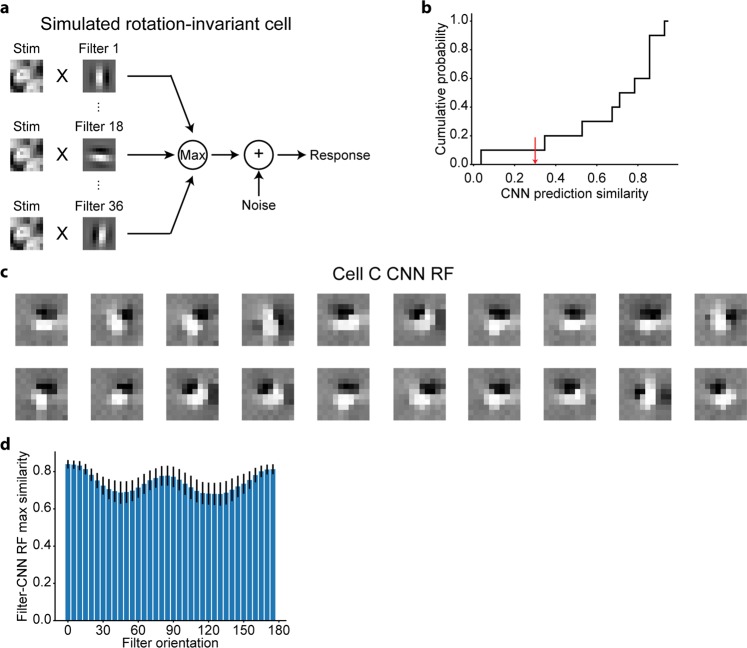
Nonlinear RFs could be estimated by CNN encoding models for simulated rotation-invariant cells. (a) Scheme of response generation for simulated rotation-invariant cells. The response to a stimulus was defined as the maximum of the output of 36 subunits followed by an additive Gaussian noise. Each subunit, which had a Gabor-shaped filter with different orientations, calculated the dot product between the stimulus image and the filter (See Methods for details). The filters of simulated cell C are displayed in this panel. (b) Cumulative distribution of CNN prediction similarity (N = 10 cells). Simulated cells with a CNN prediction similarity ≤0.3 (indicated as the red arrow) were removed from the following RF analysis. (c) Results of iterative CNN RF estimations for simulated cell C. Only 20 of the 1,000 generated RF images are shown in this panel. RF images had Gabor-like shapes but their orientations were different in different iterations. (d) Maximum similarity between each generator filter and 1,000 CNN RFs. Only cells with a CNN prediction similarity >0.3 were analysed (N = 9 cells).

