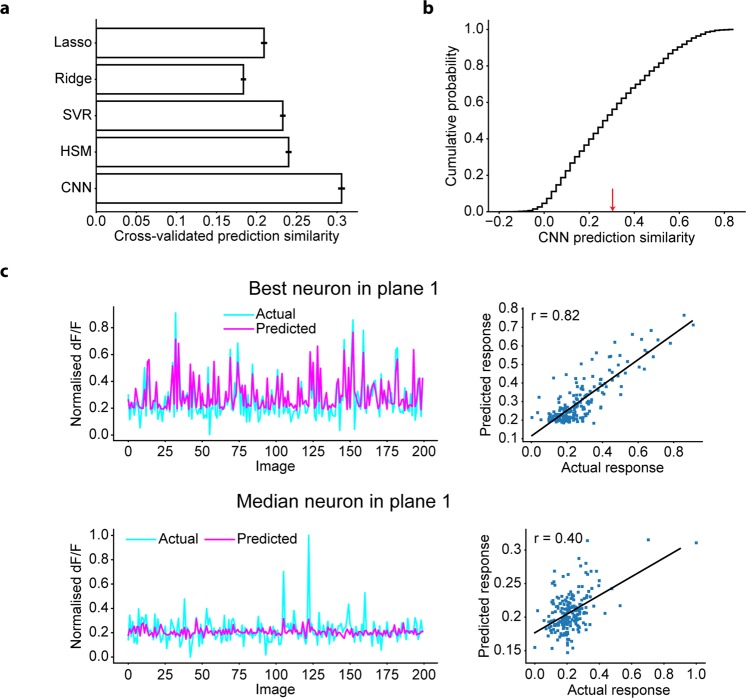
Figure 4.
Prediction of the CNN for V1 neurons. (a) Comparison of the response predictions among various encoding models: the L1-regularised linear regression model (Lasso), L2-regularised linear regression model (Ridge), SVR, HSM, and CNN. Data are presented as the mean ± s.e.m. (N = 2455 neurons). (b) Cumulative distribution of CNN prediction similarity. Neurons with a CNN prediction similarity ≤0.3 (indicated as the red arrow) were removed from the following RF analysis. (c) Distributions of actual responses and predicted responses of the neuron with the best prediction similarity in a plane (top) and the neuron with the median prediction similarity in a plane (bottom). Each dot in the right panel indicates data for each stimulus image. Solid lines in the right panels are the linear least-squares fit lines. Only data for 200 images are shown.

