Figure 5.
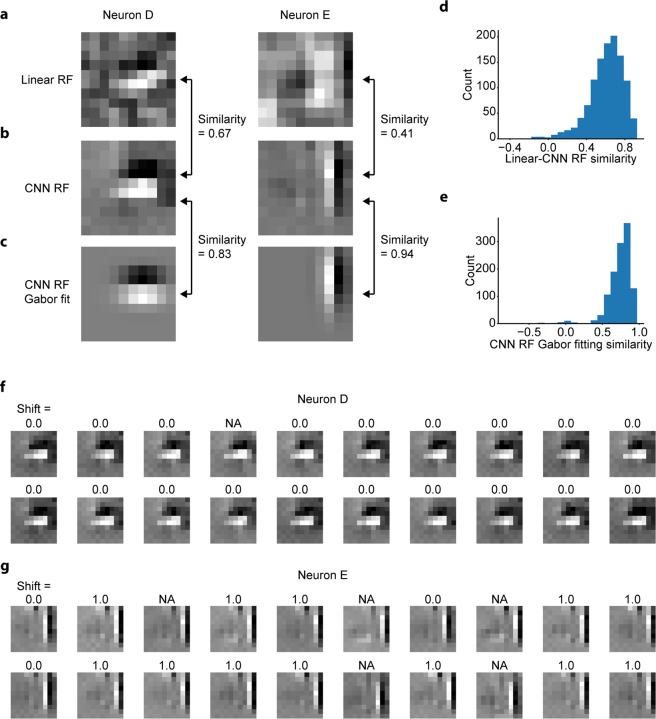
Estimating RFs of V1 neurons from trained CNNs. (a) Linearly estimated RFs (linear RFs) of two representative neurons (neurons D and E), using a regularised pseudoinverse method. (b) RFs estimated from the trained CNNs (CNN RFs) of the two representative neurons. (c) Gabor kernels fitted to CNN RFs of the two representative neurons. (d) Similarity between linear RFs and CNN RFs. Similarity was defined as the normalised pixelwise dot product between the linear RF and the CNN RF. (e) Gabor fitting similarity of CNN RFs, defined as the Pearson correlation coefficient between the CNN RF and the fitted Gabor kernel. Only neurons with a CNN prediction similarity >0.3 were analysed in (d,e) (N = 1160 neurons). (f,g) Results of iterative CNN RF estimations for neuron D (f) and neuron E (g). Only 20 out of the 100 generated RF images are shown in this figure. The number above each RF image indicates the shift pixel distance between the RF image and the top left RF image. The shift distance between the two images was calculated as the maximum distance of pixel shifts with which the zero-mean normalised cross correlation (ZNCC) > 0.95, projected orthogonally to the Gabor orientation. “NA” indicates that the ZNCC was not above 0.95 for any shift. While shift distances were zero or NA for RF images of neuron D, some RF images of neuron E were shifted to another by one pixel.

