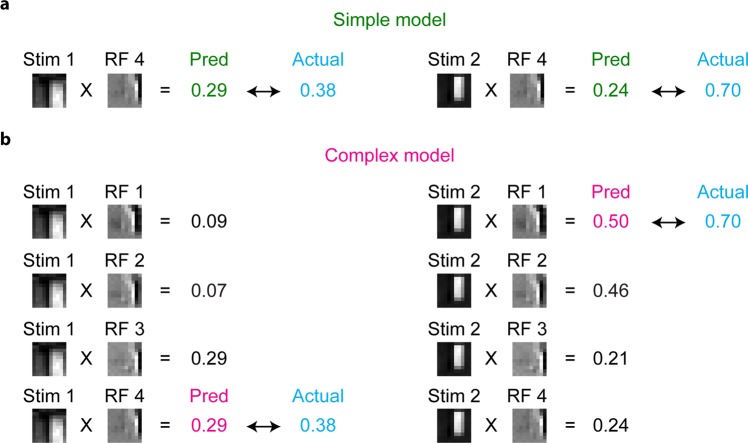
Figure 6.
Schemes of the simple model and complex model. Schemes of the simple model and complex model are illustrated using RFs and actual responses of neuron E. (a) The simple model is a linear predictive model, which predicts the neuronal response as the normalised dot product between the stimulus image and one RF image (RF 4). (b) The complex model predicts the neuronal response as the maximum of the normalised dot products of the stimulus image and several RF images (RF 1–4). Note that the complex model predicted the neuronal response to Stim 2 better than the simple model for this neuron.

