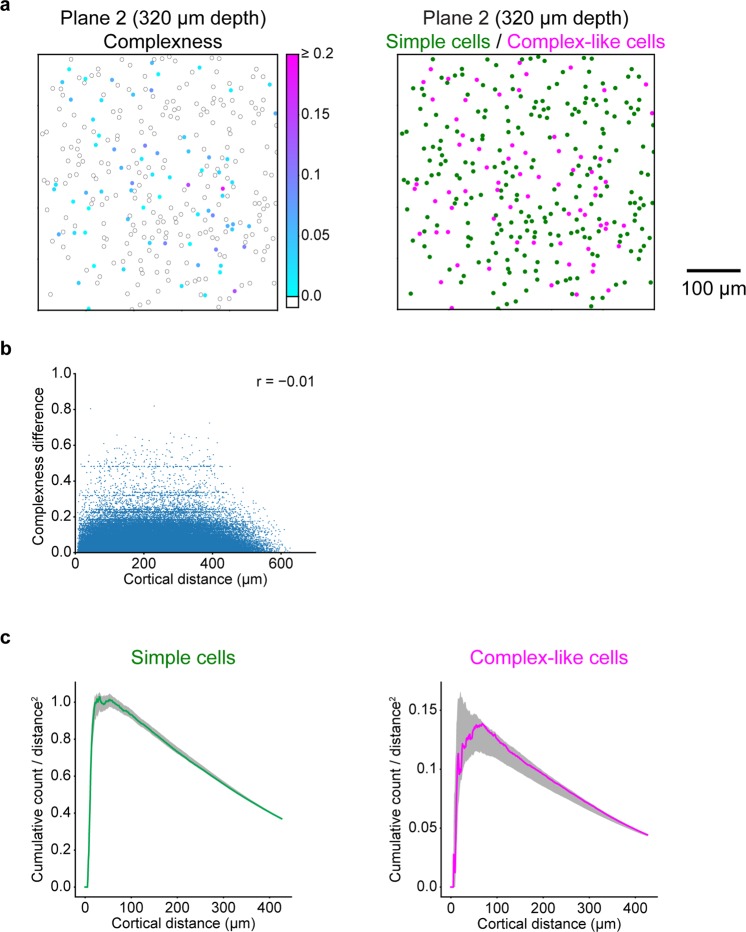
Figure 8.
Spatial organisations of simple cells and complex-like cells. (a) Left: cortical distribution of complexness for the representative plane. The position of each neuron is represented as the circle annotated by the complexness (cyan to magenta for complex-like cells (complexness >0) and white for simple cells (complexness ≤0)). Right: cortical distribution of simple cells (N = 238 neurons, green) and complex-like cells (N = 70 neurons, magenta) for the representative plane. (b) Relationship between cortical distances and differences of complexness for all simple cells and complex-like cells. (c) Cumulative distributions of the number of simple cell-simple cell pairs (left) or complex-like cell-complex-like cell pairs (right) as a function of the cortical distance, normalised by the area. Dark shadows indicate the range from the first to 99th percentile of 1,000 position-permuted simulations for each plane. The cumulative distributions were both within the first and 99th percentiles of simulations, indicating no distinct spatial arrangements of simple cells or complex-like cells.

