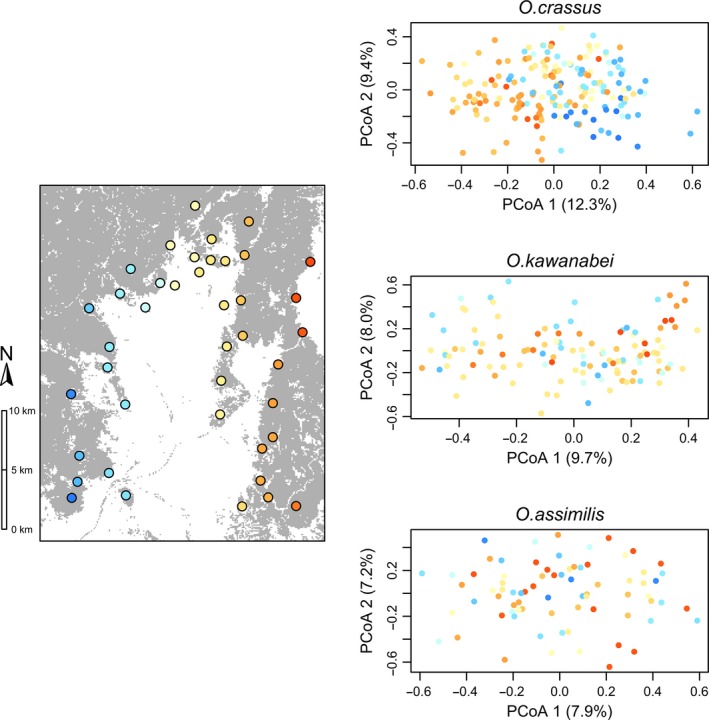
Figure 3.

Principal coordinates analyses (PCoA) of microsatellite genotypes of individual beetles. Colors of dots correspond to those of the sampling sites shown on the map. Percentages indicated on axes indicate the amount of variance explained by PCoA1 and PCoA2
