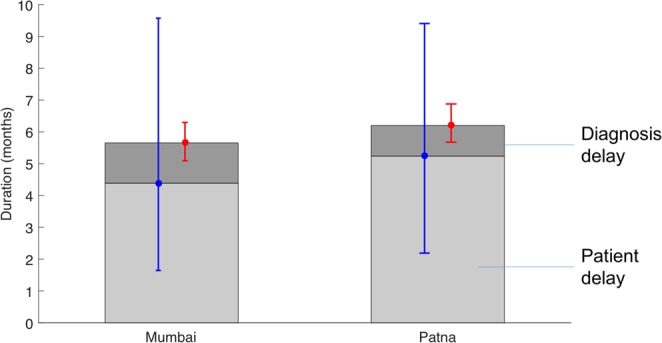
Figure 4.

Components of the mean infectious period, i.e. the duration from the start of active disease to treatment initiation, death or self cure. Simulated in the absence of any PPSA intervention. The light grey region shows the simulated patient delay, while the dark grey region shows the delay in diagnosis (i.e. from first provider visit). Error bars in blue and red show the uncertainty in these estimates, respectively. The patient delay estimate is driven by prevalence and ARTI, while the diagnostic delay estimate is driven by the process illustrated in Fig. 1B. A PPSA addressing only patient behaviour would impact only the dark grey regions.
