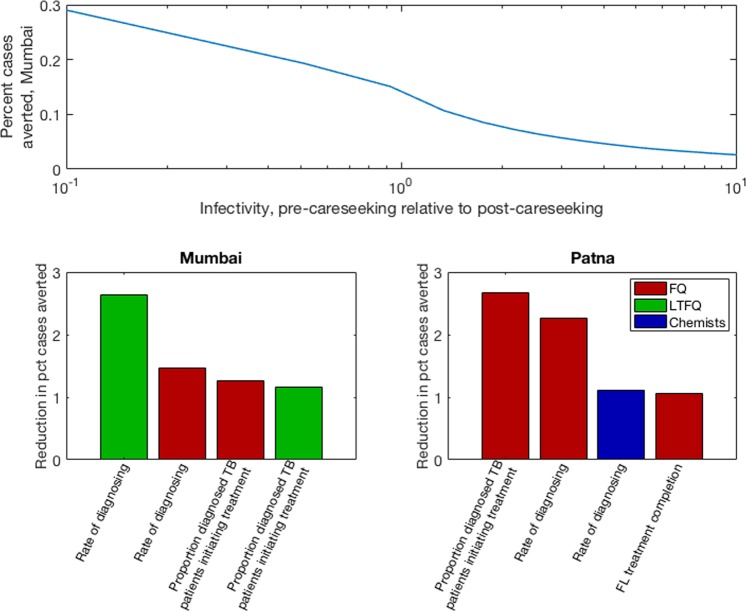
Figure 6.
Sensitivity analysis for key assumptions in the model. (A) Effect of assumptions for how TB infectivity varies during the clinical course. Shown is the impact of a PPSA at 75% coverage in Mumbai (percent cases averted over ten years). The x-axis shows a range of scenarios for the infectivity during the patient delay, relative to that during the diagnostic delay. (B,C) Identifying key elements of private provider behaviour. The figures show the drop in overall impact that results, when a PPSA that fails to improve the provider behaviour shown (while addressing all remaining provider behaviours). For clarity, plots show only the four most important factors in each setting. Bar colours denote different provider types, as shown in the right-hand legend. Panel (B) shows results for Mumbai, while panel (C) shows results for Patna.

