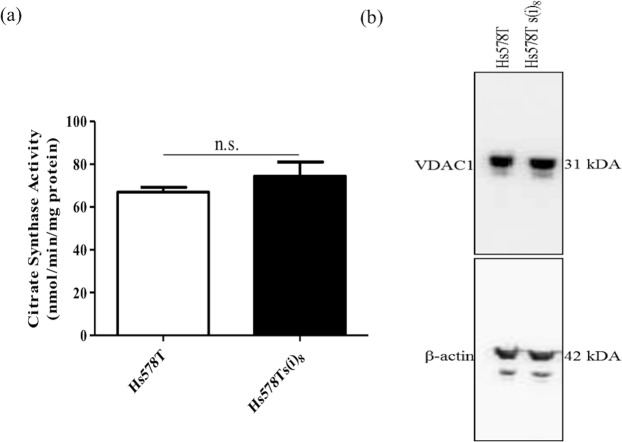
Figure 3.
Evaluation of potential alterations in the mitochondrial biomass. Analysis of mitochondrial biomass by (a). The citrate synthase assay and (b). Immunoblot for VDAC1 showed no significant differences between Hs578T and Hs578Ts(i)8 cell variants. Data is expressed as the mean ± SEM of n = 3 experiments, differences were not statistically significant (n.s.). Note: the immunoblot was cropped to approximately 6 gel bandwidths of the relevant band. VDAC1 was probed for, the transmembrane was stripped and re-probed with the anti-β-actin antibody. Due to the large qualities of VDAC1 in the cell lysates, complete stripping did not occur and faint VDAC1 bands are still visible when presenting β-actin, due to the large quantities of VDAC1. However, their size differences make them clearly distinguishable.

