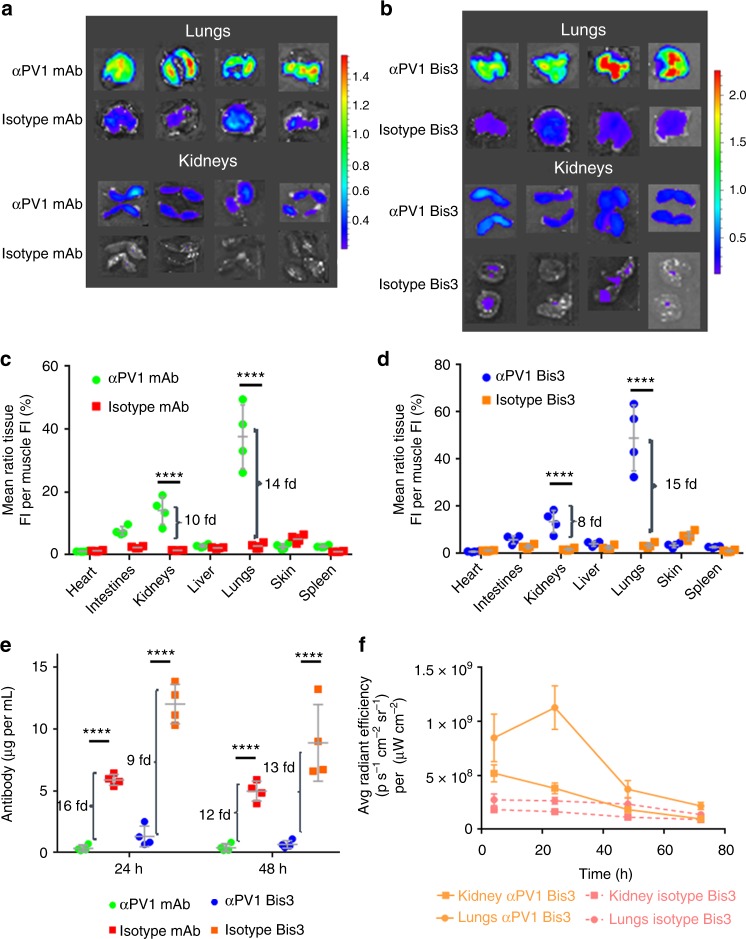
Fig. 2.
Localization of αPV1 constructs to lung and kidney via ex vivo imaging. Ex vivo imaging of lung and kidney shows higher fluorescence intensity in the lungs and kidneys of mice injected with 2 mg/kg of Alexa Fluor 680-labeled αPV1 monoclonal (a) and bispecific (b) antibodies compared with respective Alexa Fluor 680-labeled isotype controls at 24 h after intravenous injection. Quantification of fluorescence intensity from ex vivo imaging was normalized to the skeletal muscle (mean + SD) for αPV1 vs. isotype mAb (c) and for the bispecific αPV1 construct and bispecific isotype (d). Brackets indicate fold change in the fluorescence intensity of αPV1 to isotype control in lungs and kidneys. Serum antibody concentrations from the mice were quantified at 24 and 48 h (e). Tissue homing of the αPV1 results in rapid clearance of the antibody from the blood. Brackets indicate fold change in serum concentration of isotype to αPV1 antibodies. A time-course of ex vivo imaging for the bispecific αPV1 construct and bispecific isotype (f) shows lung accumulation peaking at 24 h post dosage where isotype levels are lower and relatively stable. Data are shown as the mean ± SD; ****p < 0.0001, n = 4 per group

