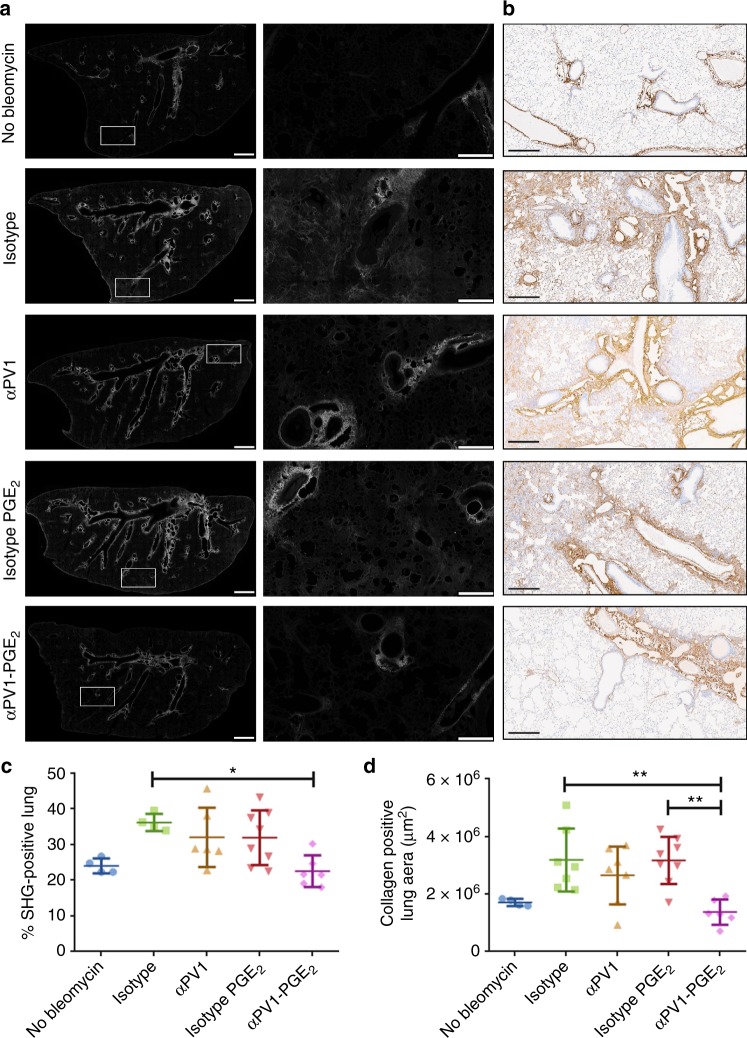
Fig. 5.
Reduced collagen deposition in bleomycin-induced fibrotic lungs treated with αPV1-PGE2. Representative second harmonic generation (SHG) images highlighting fibrillar collagen (white) deposition in mouse lung slices are shown (a). Zoomed-in images of insets (white rectangles) are shown in the middle columns. Scale bars are 1 mm for images in the first column and 250 μm for the images in the middle columns. Representative IHC images are shown generated using an anti-Cola1a antibody (b); scale bars: 300 μm. Quantitative analysis of SHG images reveal decreased fibrillar collagen in the αPV1-PGE2-treated group (c). Percent positive collagen a1a area in collagen a1a lungs are also quantified again revealing decreased collagen deposition in αPV1-PGE2-treated animals (d). Data represent mean ± SD. One-way ANOVA (Tukey post-hoc analyses) was used to evaluate the statistical significance. *p < 0.05; **p < 0.01; scale bars = 10 μm; n = 8

