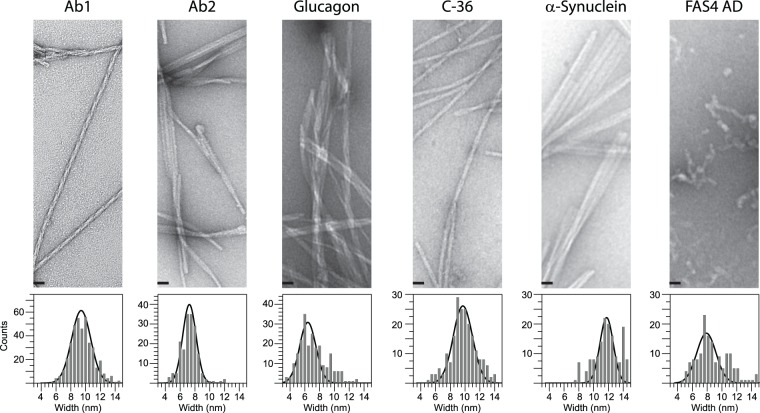
Figure 1.
Representative TEM images introducing the morphologies of Ab1, Ab2, Glucagon, C-36 and αSN fibrils together with the FAS4 AD aggregates (Top). Scale bars represent 25 nm. The average fibril width was determined to 9.4 ± 1.4 nm (Ab1), 7.3 ± 0.9 nm (Ab2), 6.4 ± 1.1 nm (Glucagon), 9.7 ± 1.3 nm (C-36), 11.8 ± 0.9 nm (αSN), 7.8 ± 1.3 nm (FAS4 AD) by a standard distribution function covering bins of 0.5 nm (Bottom). Entire images are presented in SI.

