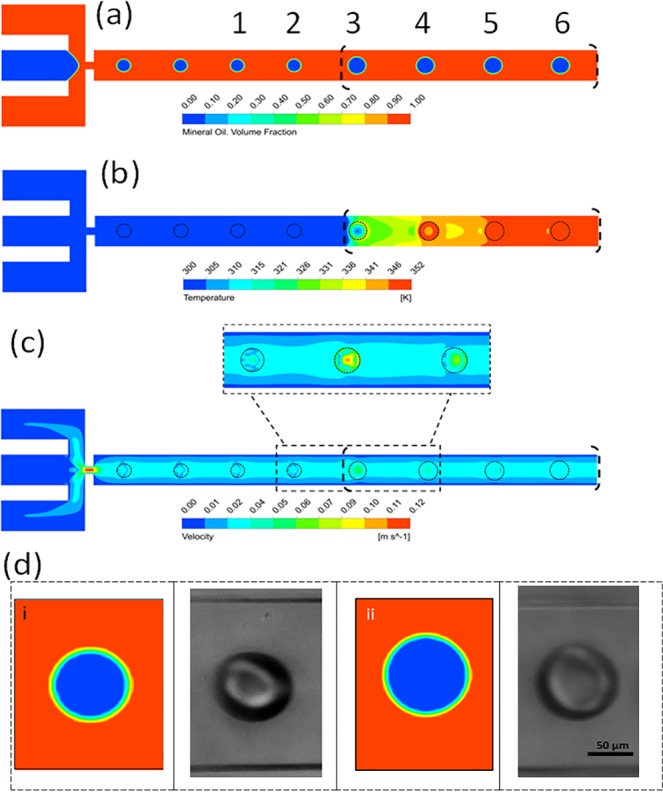
Figure 6.

The 3D simulation results of the droplet behavior in response to external thermal stimulation. (a) The effective diameter of droplets increases as it passes over the high temperature zone along the flow direction. The size of droplets #3 and #4 in Fig. 8a appears larger in 2D illustration than the actual size due to the thermocapillary effect, however the actual 3D droplet volume and its gradual increase to the temperature gradient over the heater is shown in Figs S4, S5. (b) The temperature distribution along with the flow direction indicates the pattern of high temperature zone. (c) The velocity profiles illustrating the vortices in the transient condition between the cold and hot zones. (d) The images of droplets from both simulations and experiments i) before applying heat at 25 °C and ii) after heating to 60 °C (flow rate ratio = 0.2).
