Figure 5.
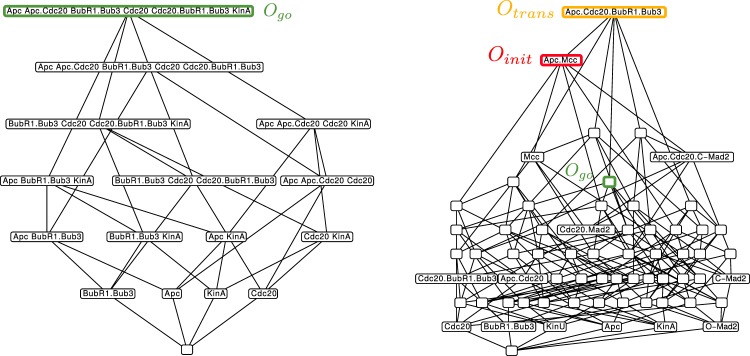
Hasse diagram of organizations from Model 1 in different modifications. Left: Organizational diagram of unmodified Model 1 (including attachment reaction KinU → KinA and the spontaneous decay of O-Mad2). The only interesting organization (see the condition in Sec. 3.1.2) is highlighted green and corresponds to all steady state species Right: Organizational diagram of modified Model 1 (no attachment reaction KinU → KinA or the spontaneous decay of O-Mad2). Here, only new species are depicted for the sake of clarity. Now there exist three interesting organizations, which are highlighted: Oinit = {APC/C, APC/C:Cdc20, APC/C:Cdc20:C-Mad2, APC/C:MCC, BubR1:Bub3 C-Mad2 Cdc20 Cdc20:BubR1:Bub3, Cdc20:Mad2, KinU, MCC O-Mad2} corresponds to the species initially present (no attached kinetochores): Otrans = {APC/C, APC/C:Cdc20, APC/C:Cdc20:BubR1:Bub3, APC/C:Cdc20:C-Mad2, APC/C:MCC, BubR1:Bub3, C-Mad2, Cdc20, Cdc20:BubR1:Bub3, Cdc20:Mad2, KinA, KinU, MCC, O-Mad2} corresponds to the transitional phase (both attached and unattached kinetochores are present): Ogo = {APC/C, APC/C:Cdc20, BubR1:Bub3, Cdc20, Cdc20:BubR1:Bub3, KinA, O-Mad2} is the same organization as on the left side (only attached kinetochores).

