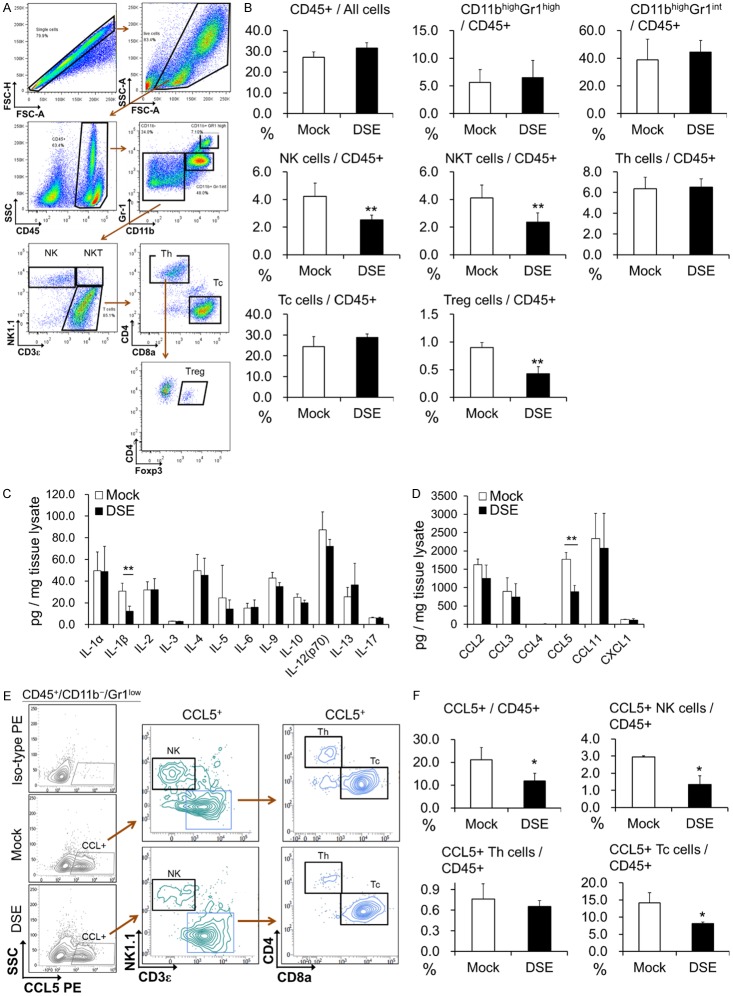
Figure 3.
Analysis of tumor infiltrated immune cells and cytokines in C57BL/6 mice tumor model. (A) Representative gating strategy for identifying different cell population in tumor tissue. (B) Percentage of tumor infiltrated immune cell population 10 days after cell transplantation. Data is represented as the mean ± SD. **P < 0.01, n = 7 for each group. (C) Expression of cytokines in transplanted tumor tissue, and (D) expression of CCL2, CCL3, CCL4, CCL5, CCL11, and CXCL1 in transplanted tumor tissue. **P < 0.01, n = 5 for each group. (E) Identifying CCL5 expressing cells in tumor tissue. Flow cytometry plots staining for CCL5 PE in mock or DSE Hepa1-6 tumors, gated on live CD45+/CD11b-/Gr1low cells. Iso-type PE was taken as negative stain control. Representative data was shown from 5 mice for each group. (F) Percentage of CCL5+ immune cell population in tumor tissue 10 days after transplantation. Data is represented as the mean ± SD. *P < 0.05, n = 5 for each group.

