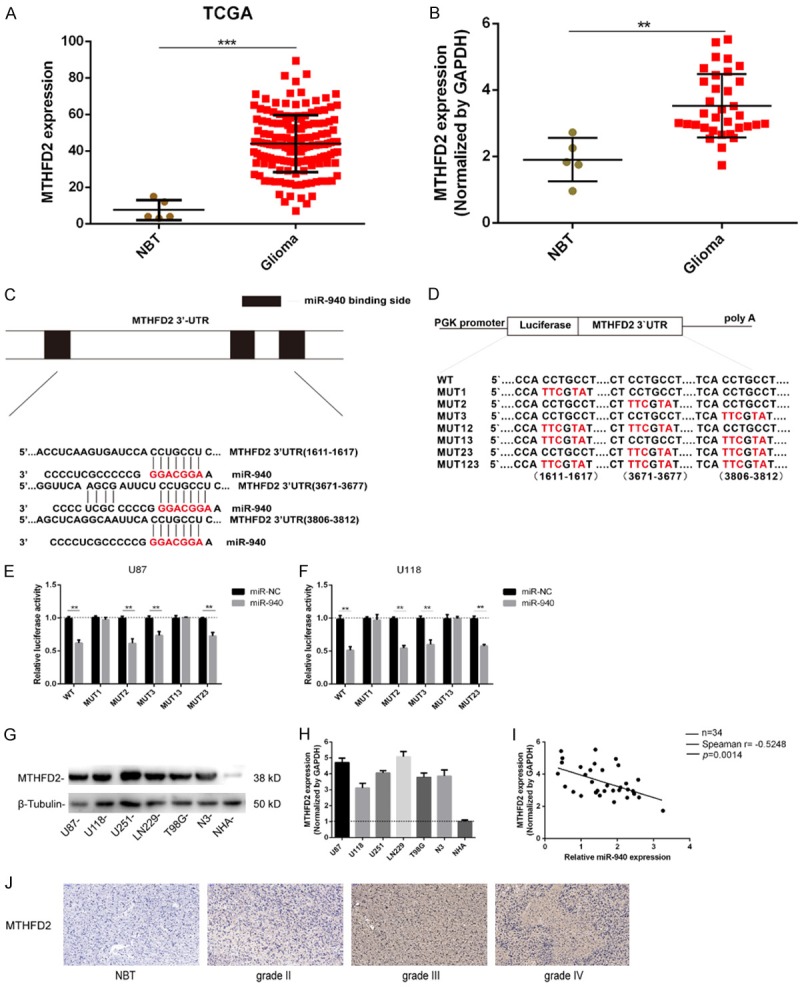
Figure 5.

miR-940 directly targets MTHFD2 and negatively regulates its gene expression. A. Relative expression data for MTHFD2 was download from the TCGA database (normal tissues, n=5; glioma tissues, n=530). P<0.0001. B. The expression levels of MTHFD2 in the clinical database (5 NBT samples from traumatic brain injury and 34 glioma tissue samples). C. Predicted miR-940 target sequences in the MTHFD2 3’-UTR. D. Construction of WT and Mut 3’-UTR reporter plasmids. E, F. Luciferase reporter assays were used to assess U87 and U118 cells cotransfected with WT or Mut 3’-UTR reporter plasmids and miR-NC or miR-940 mimic. G. The expression of MTHFD2 in different glioma cell lines and NHAs was determined by Western blotting and normalized to the expression of β-tubulin. H. The expression of MTHFD2 in the cell lines was determined by qRT-PCR and normalized by GAPDH. I. Spearman’s correlation analysis of the expression of miR-940 and MTHFD2 in 34 clinical glioma cases. Spearman r=-0.5248, P=0.0014. J. The expression of MTHFD2 in normal and glioma tissues was analyzed by IHC; scale bar =50 μm. The data are expressed as the mean ± s.e.m.
