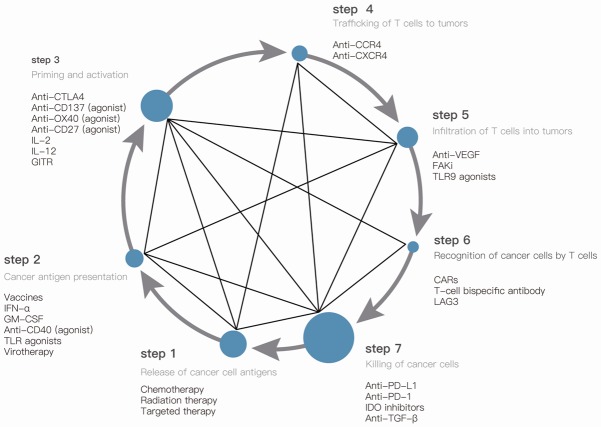
Figure 3.
Connection diagram of ongoing clinical trials investigating the effect of combination strategies in CIC. The therapies are given in each step of CIC. Promising prospects of combination strategies are connected with solid line [4-6]. The larger the dot is, the more combination therapy recorded at the ClinicalTrials.gov.

