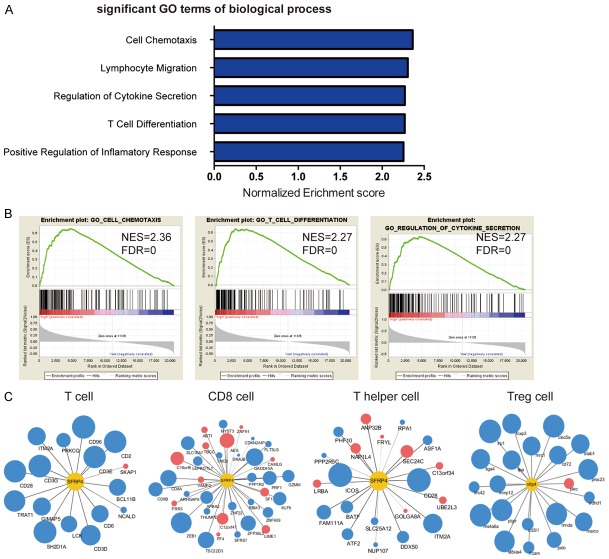
Figure 4.
Correlation between SFRP4 expression and Treg cell infiltration in PDAC. A, B. GSEA shows the presentative GO term of biological process that positive correlates with SFRP4. C. The correlation between the expression of signature genes of T cell, CD8 cell, T helper cell, Treg cell and the expression of SFRP4. The size of the dots represents the correlation coefficient and the blue dots represent the positive correlation while the red dots represent the negative correlation. The data was analyzed from TCGA-PAAD database and demonstrated by Cytoscape.

