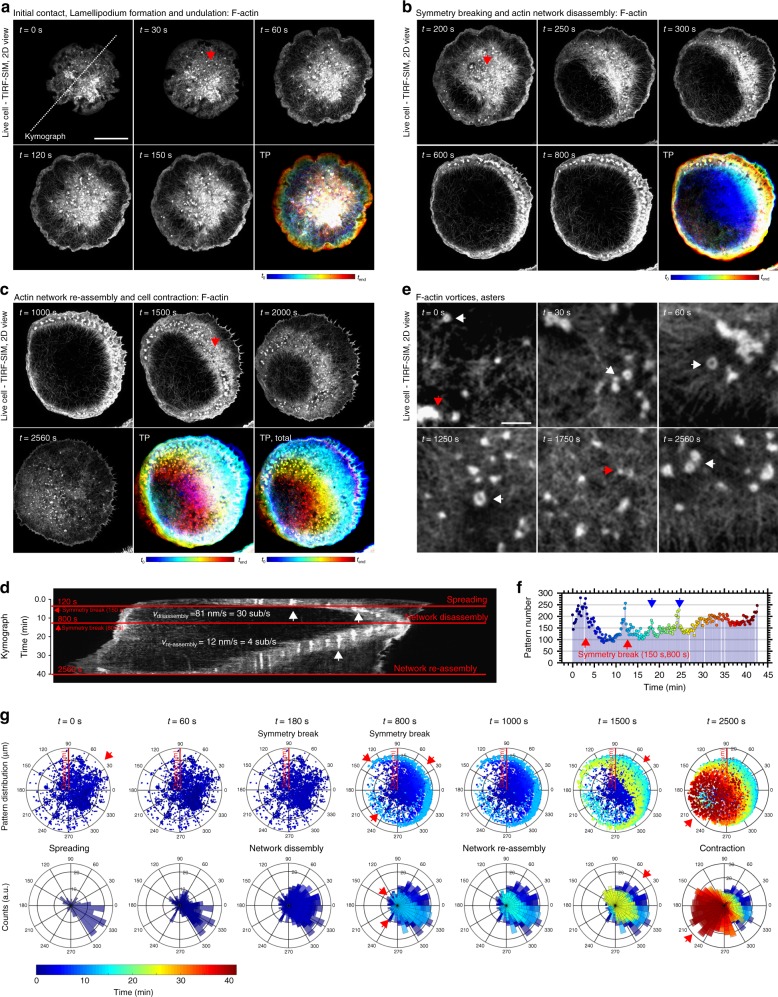
Fig. 1.
Spatio-temporal actin cytoskeleton reorganization during rat basophilic leukemia (RBL) cell activation. Representative extended total-internal-reflection-fluorescence coupled with structured-illumination microscopy (eTIRF-SIM) experiment of F-actin (Lifeact-citrine) at the basal membrane of RBL cells at different times t after contact formation with the activating microscope coverglass. a–c Images outlining the different stages of initial contact formation and lamellipodium formation and undulation (a, t = 0–150 s), symmetry breaking and central F-actin network disassembly (b, t = 200–800 s) and F-actin network reassembly (c, t = 1000–2560 s). The overall actin reorganization is highlighted by the respective temporal projections (TPs, lower right panels, total t = 0–2560 s) with cold colors (early times) transforming into warm colors (late times). Red arrows point at representative actin patterns. Scale bar: 10 μm. d Temporal kymograph along the dashed line marked in a (intensity at the same spatial x-positions along the line over time with time as y-axis starting from top), and with red horizontal lines indicating the different stages, spreading at t < 120 s, symmetry break at 150 s, central network disassembly until 800 s, at the time point of the next symmetry break, and finally central network reassembly until 2560 s. Tracking of the positions of the edges over space and time determines the velocities vdisassembly and vreassembly of the disassembling and re-assembling actin waves. e Zoom-in into different parts of a–c at times t as marked, highlighting the appearance of actin patterns such as asters (red arrows) and vortices (white arrows). Scale bar: 1 μm. f Total number of patterns identified at different times t from recordings on 35 cells, indicating peaks at the time-points of symmetry breaking (red arrows, t = 150 s and 800 s) and at later time-points (blue arrows). g Localization of individual actin patters at different time-points t as taken from a–c: (upper panels) scatter-plot of spatial positions within the circular cell interface, and (lower panels) directional histograms with the number of patterns identified within a certain segment of the circular cell interface displayed by the lengths of the respective segmental column bars. Cold blue colors indicate early time-points and warm red colors late time-points. The patterns cumulated at the leading edge and actively followed the propagating F-actin

