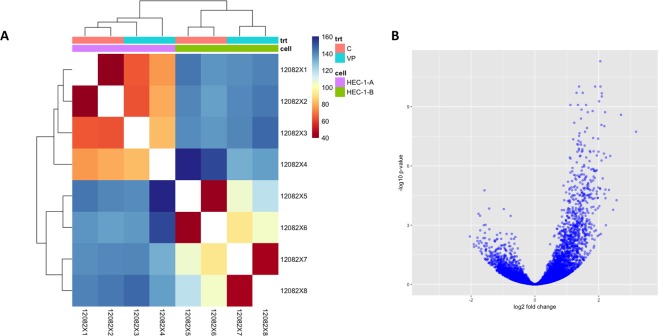
Figure 1.
Gene expression modulated by VP. (A) Expression heat map of sample-to-sample distances on the matrix of variance-stabilized data for overall gene expression. trt = treatment; C = Control; VP = Verteporfin treated. Clustering differentiates between control and VP treated samples. This heatmap was built using DESeq 2 on normalized gene read counts. All of the rlog values of the dispersion estimates were clustered using the R distance function (dist) to calculate the Euclidean distance between samples. Distance plot for HEC-1A and HEC-1B cell lines showing their control and VP-treated versions. (B) Differential gene expression, with fold difference between log2 normalized expression in control (n = 2) and VP treated (n = 2) plotted versus −log10 adjusted P-value. Each gene is colored based on the log10 base mean expression.

