Figure 2.
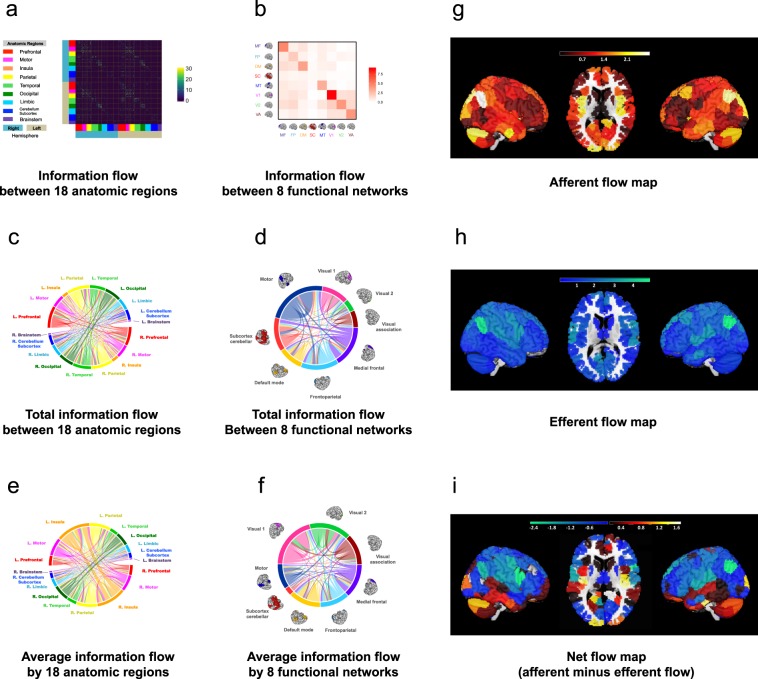
Average whole-brain information flow in a group. (a) The 268 × 268 asymmetrical information flow matrix averaged from 550 individual information matrices. The matrix is defined on 18 anatomic regions using a 268-node functional atlas. The atlas is based upon an independent data set of healthy control subjects using a group-wise spectral clustering algorithm17. Every entry contains a selected F-value from the lag-adjusted Granger-Geweke test between two time courses, or 0, if the F-value is not selected. An edge is selected if its average p-value across all subjects is smaller than 0.05. (b) The 8 × 8 asymmetrical information flow matrix defined on 8 functional networks. The value for each entry is the mean F-values associated with a functional brain network summarized from the 268 × 268 matrix in (a). (c) Total information flow map between 18 anatomic regions. The map contains 3,927 significant directed edges organized on 18 regions as in (a). The color of the edge indicates the origin of the flow. For example, the red curved line crossing the circle starting from the left (red bar) to the lower right (light orange bar) indicates information flow from left prefrontal region to right insula region. (d) Total information flow map between 8 functional networks. The same 3,927 edges in (c) now visualized on 8 functional brain networks. (e) Average information flow between 18 anatomic regions. The total amount of information flow from each anatomic region specified in (c) divided by the number of node in the region. (e) Average information flow between 8 functional networks. The total amount of information flow from each functional network specified in (d) divided by the number of node in the region. (g–i) Afferent, efferent, and net information flow maps of the whole brain. The brain images in (b, d and f) are adapted by permission from RightsLink Permissions Springer Customer Service Centre GmbH: Springer Nature Neuroscience “Functional connectome fingerprinting: identifying individuals using patterns of brain connectivity” by Finn et al. Copyright 2015.

