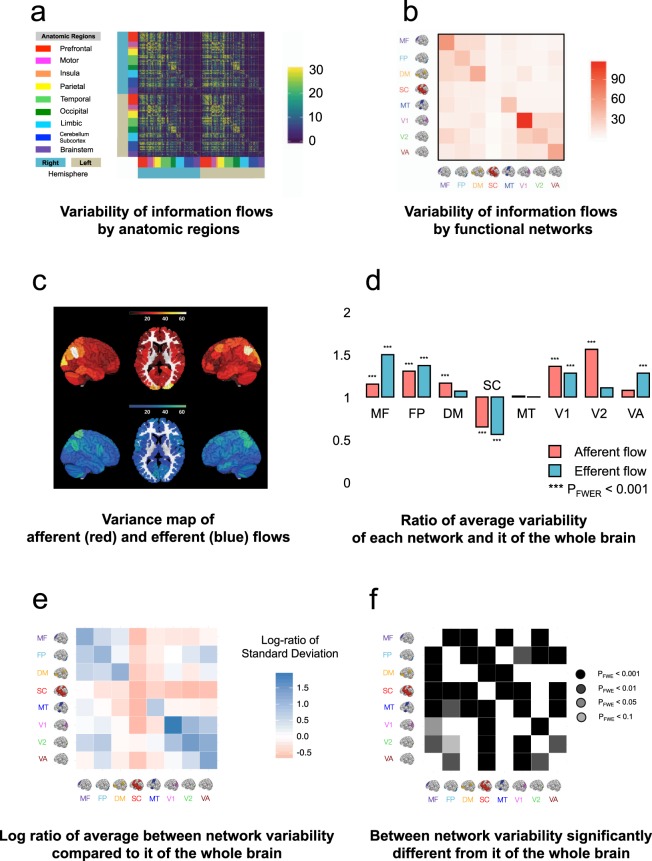
Figure 5.
Analysis of variance of the whole-brain information flows. (a) The variance of 268 × 268 asymmetrical information flow map across 550 subjects. Every entry contains the variance of the F-value between two time courses across subjects. In the figure, for color contrast convenience, if an F-value is greater than 100, we fix it at 100. (b) The variance of 8 × 8 asymmetrical information flow map across all subjects defined on 8 functional networks. Every entry is the mean variance of F-value associated with a functional brain network summarized from the 268 × 268 matrix in (a). (c) The variability map of afferent (in red color) and efferent flows (in blue color). (d) The variability of afferent (red) and efferent flows (blue) associated with each network compared to it of the whole brain. The height of each histogram quantifies the average variance of F-values corresponds to each network, which were visualized in panel (c), compared to it of the whole brain. A pair-wise ANOVA test determines the significance level. All p-values were adjusted for FWER. (e) The log-ratio of average variation of information flows between each pair of networks. Each log-ratio was calculated in two steps. First, we found the average variations of the efferent flow from nodes linking regions A and B - it measures the average variability of the efferent flow from region A to region B. We also found the average variations of the afferent flow from regions B to A - it measures the average variability of the afferent flow from region A to region B. Second, we calculated the natural log of these two average variations. The darker a blue square was, the more variability of information flowing out from the brain region denoted by the reference brain image on the horizontal direction than the variability of the opposite information flows; the darker a red square was, the more variability of information flowing into the brain region denoted by the reference brain image on the horizontal direction than the variability of the opposite information flows. (f) The significance of the between-network variability. The darker the green square, there was more significant a difference between the variability of the information flows from opposite directions (namely, the variability of information flow from region A to B compared to it from region B to A). The size of the difference (namely, whether there is more variability of the information flow from region A to B than it from B to A) can be determined from the map in (e). The comparison was done using a pair-wise ANOVA test. All p-values were adjusted for FWER. The brain images in (e) and (f) are adapted by permission from RightsLink Permissions Springer Customer Service Centre GmbH: Springer Nature Neuroscience “Functional connectome fingerprinting: identifying individuals using patterns of brain connectivity” by Finn et al.1.

