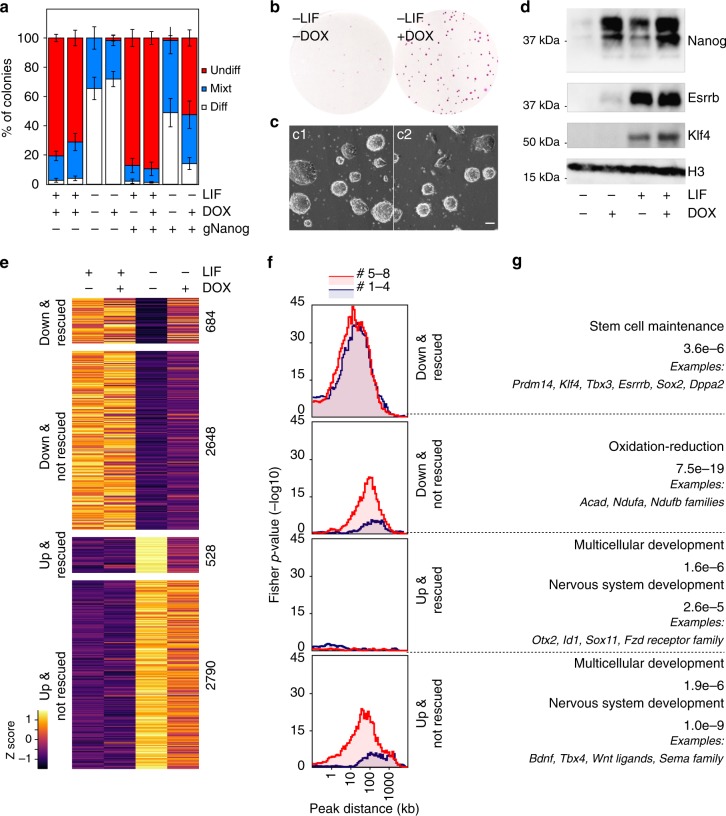
Fig. 4.
Endogenous induction of Nanog mediates LIF-independent self-renewal by non-canonical mechanisms. a Histogram representing the percentage of undifferentiated (red), mixt (blue) and differentiated (white) colonies (Y-axis) counted after 6 days of clonal growth in the indicated conditions (X-axis). Error bars represent std. dev. (n = 4). b Representative image of Alkaline Phosphatase stained colonies after 6 days of clonal growth in the presence/absence of Dox. c Representative image of the two SunTag clones after culturing them in 2i for 3 days following a 6-day clonal assay in the absence of LIF and the presence of Dox. The scale bar represents 50 µm. d Representative Western-Blot of Nanog, Esrrb and Klf4 after 3 days of culture in the indicated conditions. e Heat map representing gene expression z-scores across 4 groups of transcripts, as indicated in the left. UP/DOWN refers to their expression changes after 3 days of LIF deprivation (FDR < 0.05); rescued versus not rescued indicates whether Nanog significantly alleviates their misregulation (FDR < 0.05). f Plots displaying the -log10 Fisher p-value (Y-axis) of the enrichment of genes belonging to the groups identified in e at a given distance (X-axis) from Nanog binding clusters 1 to 4 (red) and 5 to 8 (blue), as established in Fig. 3. g Representative Gene Ontology terms enriched in each group of genes. The FDR is indicated together with selected examples

