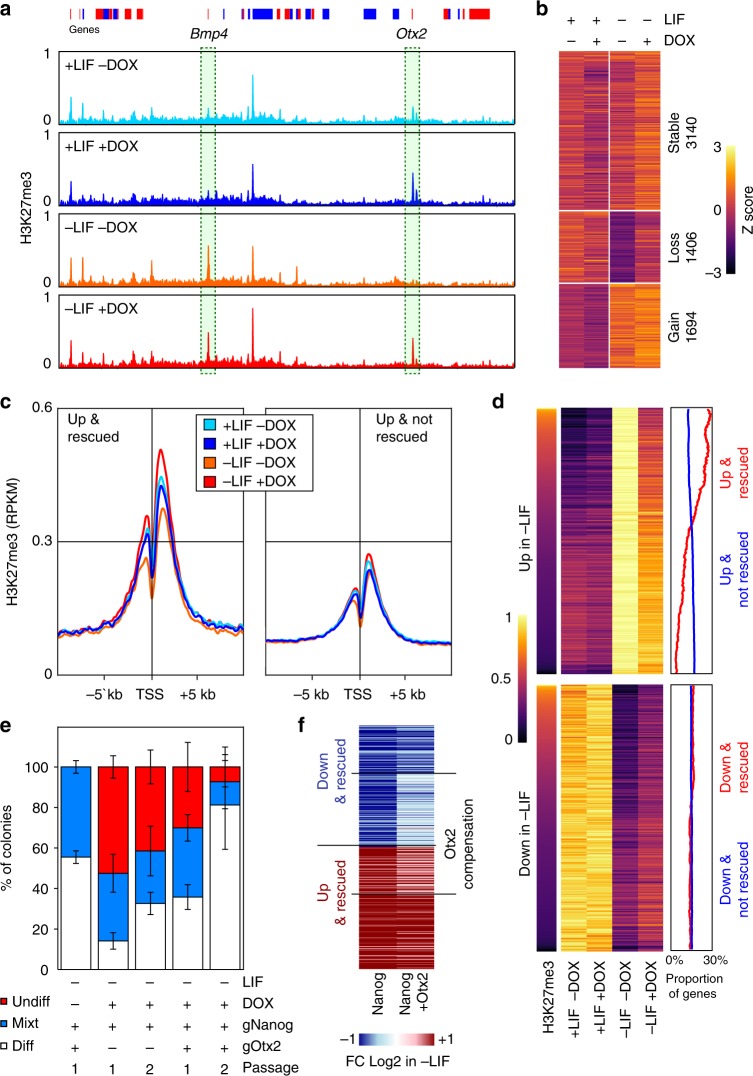
Fig. 5.
A Nanog/H3K27me3/Otx2 axis controls LIF-independent self-renewal. a H3K27me3 average levels (reads per million) across 5.15 Mb (mm9: chr14:45346123–50415313, red and blue boxes represent genes on the +and − strands) encompassing the Bmp4 and Otx2 genes that display the two stereotypical behaviours observed in SunTag cells cultured in the presence/absence of LIF/Dox for 3 days. b Heat map of H3K27me3 z-scores of 6,240 H3K27me3 domains identified in SunTag cells cultured as indicated. c Average H3K27me3 (reads per million) across promoter regions of genes upregulated in the absence of LIF and either rescued (left) or not (right) by Nanog. d Correlative analysis of ranked H3K27me3 (left) with gene expression changes (arbitrary units; middle) for transcripts upregulated (top) or downregulated (bottom) in SunTag cells cultured in the presence/absence of LIF/Dox for 3 days. The percentage of genes belonging to rescued (red line) versus non-rescued genes (blue line) in a 500 gene sliding window across the regions of the heat map is shown on the right. e Histogram representing the percentage of undifferentiated (red), mixt (blue) and differentiated (white) colonies (Y-axis) counted after 6 (Passage 1) or 12 (Passage 2) days of clonal growth in the indicated conditions (X-axis). Error bars represent std. dev. (n = 4). f Heat map of the average log2 fold change +Dox/−Dox in gene expression between SunTag cells activating either Nanog or Nanog and Otx2, grown in the absence of LIF and the presence/absence of Dox for 3 days. Genes for which the simultaneous activation of Otx2 compensates the changes observed when only Nanog is induced (FDR < 0.05), are highlighted

