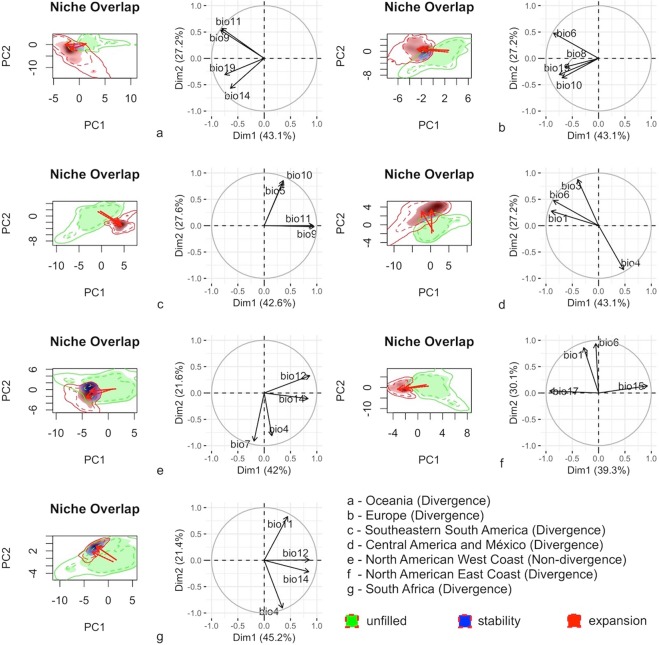
Figure 2.
Principal component analysis ordination indicating the climatic variables most relevant to the Ligustrum lucidum niche shift during invasion (green = unfilled climatic condition in the invaded area; red = climatic expansion in the invaded area; blue = climatic stability) into different regions (a - Oceania; b - Europe; c - Southeastern South America; d - Central America and Mexico; e - North American West Coast; f - North American East Coast; and g - South Africa). The first two axes of each PCA represent the environmental space. The continuous lines represent the available climatic space. The dashed lines represent the species occurrence density. The arrows indicate the change in the centroid from the native range to the invaded area. (bio 1 = Annual Mean Temperature; bio 3: Isothermality; bio 4: Temperature Seasonality (standard deviation ×100); bio 5: Maximum Temperature of the Warmest Month; bio 6: Minimum Temperature of the Coldest Month; bio 7: Annual Temperature Range; bio 8: Mean Temperature of the Wettest Quarter; bio 9: Mean Temperature of the Driest Quarter; bio 10: Mean Temperature of the Warmest Quarter; bio 11: Mean Temperature of the Coldest Quarter; bio 12: Annual Precipitation; bio 14: Precipitation of the Driest Month; bio 15: Precipitation Seasonality; bio 17: Precipitation of Driest Quarter; bio 19: Precipitation of the Coldest Quarter).

