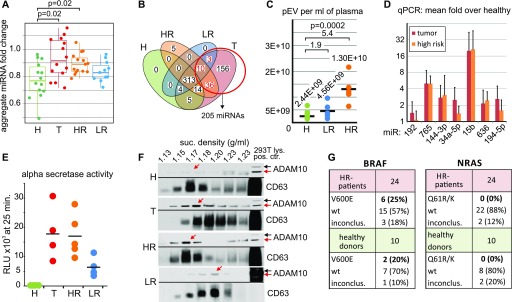
Figure 2. Increased levels of pEVs in melanoma patients after R0 surgery.
(A–C) Increased pEV miRNA levels per volume plasma in melanoma patients. (A) Relative levels of pEV miRNAs in healthy controls (H), melanoma patients with tumor burden (T), and in patients with LR or HR of tumor relapse after R0 surgery (Table S1). Each dot represents the average pEV miRNA level of all detected miRNAs/volume plasma from one patient and was calculated as geometric mean of the patient's miRNA fold increases relative to each miRNA's mean expression in healthy controls. (B) Venn diagram showing the distribution of miRNAs that discriminated healthy individuals and tumor patients (red circle) over all melanoma patient groups. (C) pEV number analysis in gradient-purified pEV derived from five LR and five HR patients randomly selected from patients described in Table S1 and nine healthy controls (same as in 1F). Analysis as in Fig 1F. (D) Quantitative PCR analysis on miRNAs up-regulated in pEVs from melanoma patients and healthy controls. Randomly selected miRNAs that were up-regulated in T patients were analyzed in parallel in pEV probes from healthy controls, HR, and T patients. Bar diagrams depict the average fold increase over healthy controls. Error bars represent the SDM of pEV samples from five representative patients or controls (Table S1). The whole procedure is detailed in Fig S3. (E, F) Patient's pEVs harbor ADAM10 activity. (E) Sucrose gradient–purified pEVs (equivalent to 1 ml of plasma) from healthy controls and melanoma patients were analyzed for alpha secretase activity using a commercial assay (SensoLyte, AnaSpec) similar as described recently (Lee et al, 2016). (F) Western blot demonstrating activated ADAM10 in melanoma pEVs. Sucrose gradient fractions purified from plasma (15 ml: pool from three patients [each 5 ml]) of T, HR, and LR patients containing purified pEVs were blotted for ADAM10 and the EV marker CD63. The red arrows depict activated ADAM10. (G) PCR amplification and Sanger sequencing of BRAF and NRAS cDNA obtained from purified HR patient pEVs. pEVs were purified from 24 HR patients and 10 healthy controls by differential centrifugation of 4 ml plasma. The table summarizes the sequencing results of the PCR amplification products for BRAF and NRAS. inconclus: inconclusive (for the presence of the mutation).

