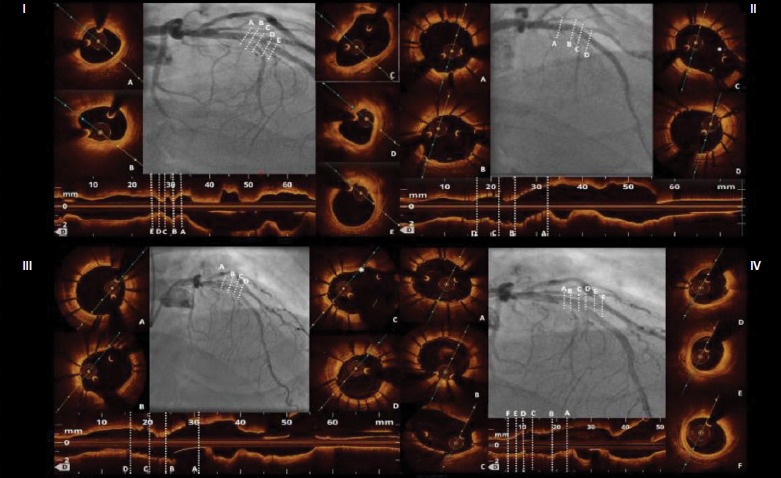
Figure 2: Use of OCT at Different Stages of Assessment.

Panel I. OCT baseline lesion assessment. A: Proximal lumen reference; B, C: Quality characterisation of plaque composition showing fibro lipidic plaque with mild calcifications; D: MLA: 2.80 mm2; E: Distal lumen reference. Panel II. OCT assessment post stent deployment. A: Proximal stent edge; B: Pre-bifurcartion cross section; C: Cross section at the bifurcation site with jailed wire into the side branch (*); D: Distal stent edge. Panel III. OCT-guided side branch rewiring and kissing balloon optimisation. A: Better stent expansion at the proximal edge and (B) proximally to the bifurcation site; C: Stent cells are well opened at the bifurcation site after rewiring and kissing balloon dilatation (* indicates the only malapposed strut); D: Cross section after the bifurcation site showing good stent apposition and expansion without stent deformation after kissing balloon optimisation. Panel IV. OCT assessment of the side branch after stent implantation. A, B: Cross sections show optimal stent implantation proximally to the bifurcation; C: Widely opened side branch ostium without significant stent malapposition; D: No evidence of dissection at the side branch ostium with MLD of 2.6 mm; E, F: Distally to the side branch ostium there is evidence of fibro-lipidic plaque without significant stenosis of the lumen. OCT = optical coherence tomography; MLA = minimal lumen area; MLD = minimal lumen diameter..
