
Figure 3.
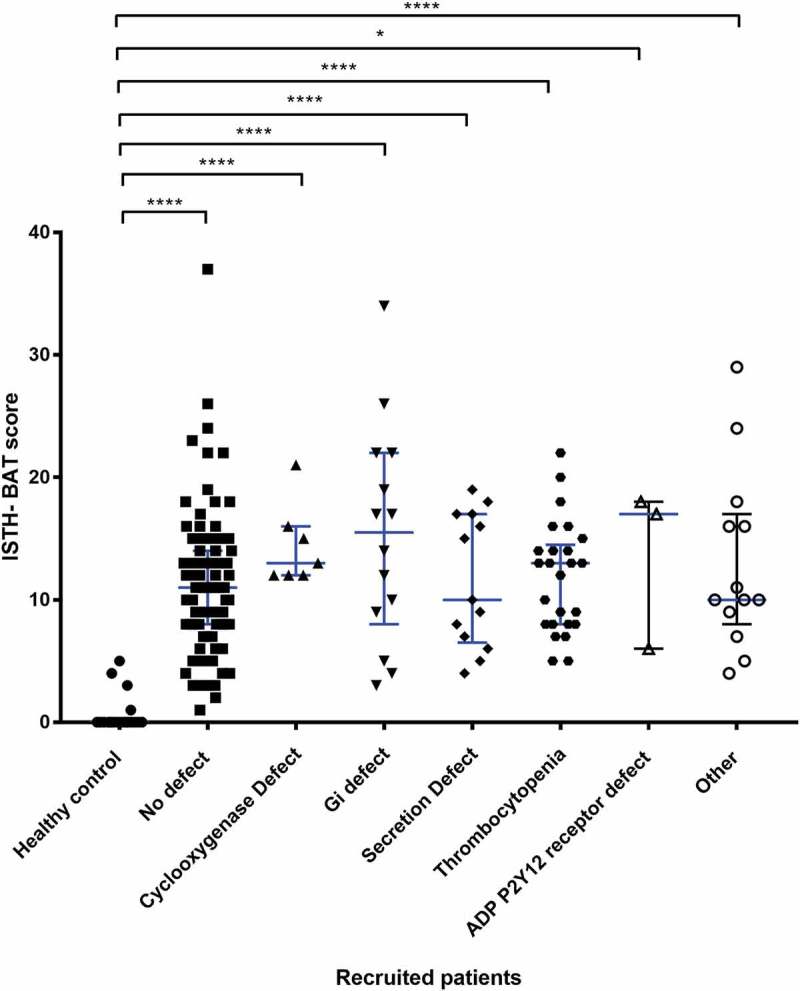
The relationship between the type of platelet defect identified by lumiaggregometry and the ISTH-BAT score.
A scatter dot plot showing the spread of ISTH-BAT scores between the platelet defects identified on lumiaggregometry, healthy controls (n = 21), No defect (n = 88), defect (n = 75) of which; cyclooxygenase defect (n = 7), Gi receptor signalling defect (Gi defect) (n = 14), Secretion defect (n = 13), thrombocytopenia (n = 25), ADP receptor defect (n = 3) and other (n = 13). Horizontal bars indicate median and interquartile range. Statistical analysis was performed using non-parametric Kruskal-Wallis and Dunn’s multiple comparisons test, the mean rank of each column was compared with the mean rank of every other column. Statistically significant difference is denoted by * = P < 0.05, **** = P < 0.0001, no statistically significant difference (P > 0.05) was observed between the platelet defect subgroups.