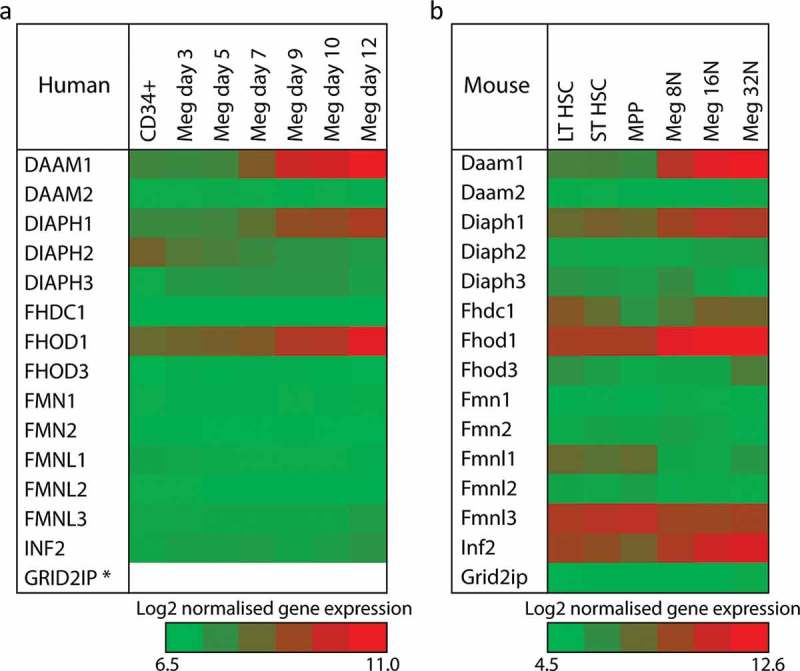
Figure 3.

Expression of mammalian formin proteins during megakaryocyte development.
a) Relative expression levels of the 15 mammalian formin proteins during the development of human megakaryocytes. CD34+ cells from umbilical cord blood were cultured in vitro in the presence of thrombopoietin and interleukin 1β and gene expression quantified by RNA-seq. Data are taken from the Blueprint epigenome project (http://www.blueprint-epigenome.eu/) and (35). * Note – no data was available for the expression of GRID2IP. b) Relative expression levels of the 15 mammalian formin proteins during the development of mouse megakaryocytes. Bone marrow cells from C57BL/6 mice were sorted using FACS and gene expression quantified by microarrays. Data are taken from the haemosphere database (http://haemosphere.org/) and (36). For both panels, Log2 of normalised gene expression is represented by a heat map where red equals increased gene expression. Gene names in this figure and throughout the review use the conventions of the HUGO Gene Nomenclature Committee (www.genenames.org) and the Mouse Genome Informatics (www.informatics.jax.org) for human and mouse genes, respectively.
