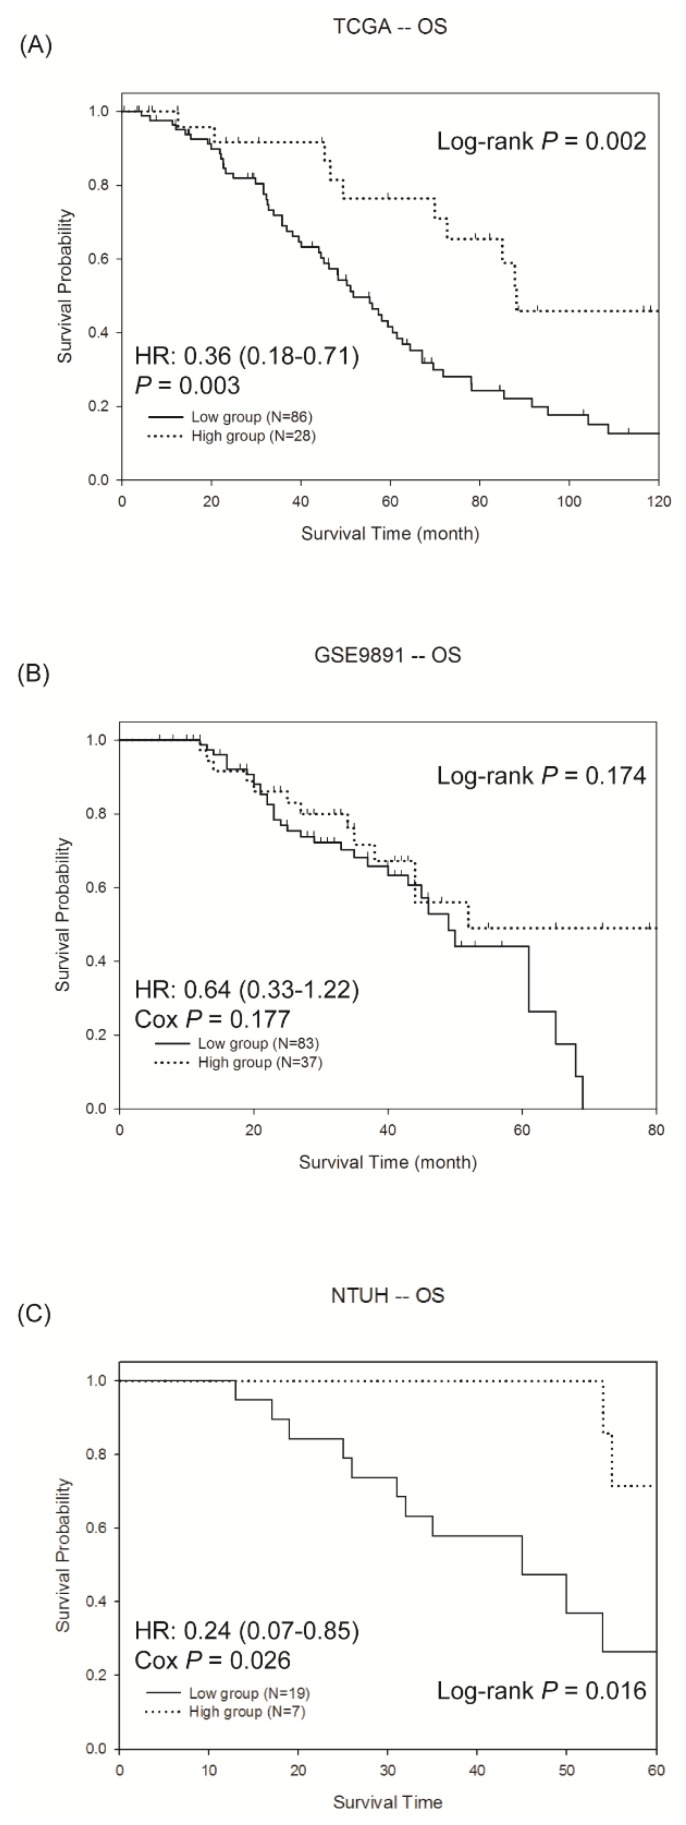
Figure 3.
The Kaplan-Meier survival curves of the overall survival (OS) in the high and low response groups in the (A) TCGA dataset, (B) GSE9891 dataset and (C) NTUH patients. Patients of high response group had longer OS than low response group in the three cohorts. The hazard ratio (HR) was estimated by the Cox hazard regression model.

