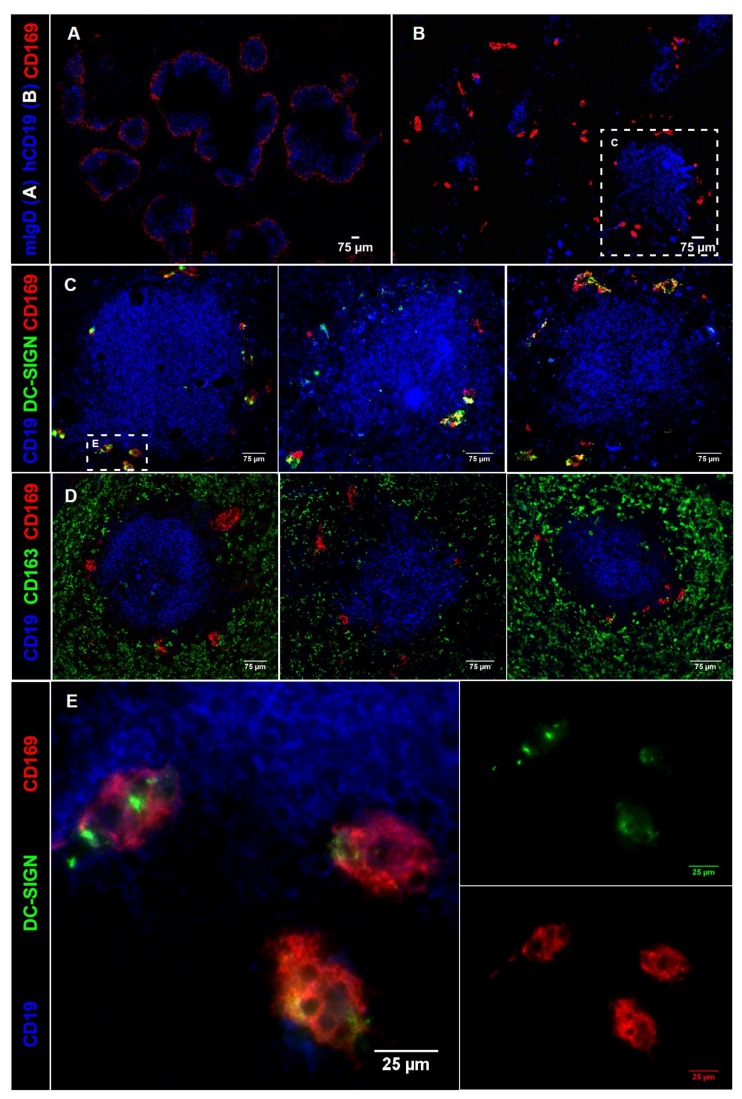
Figure 3.
CD169 expression in mouse and human spleen. (A) Mouse spleen overview section stained for IgD (blue) and CD169 (red). (B) Human spleen overview section stained for CD19 (blue) and CD169 (red). (C) B cell follicles (blue) in human spleen from three different donors, CD169+ cells (red) and DC-SIGN+ cells (green). The first panel is a zoom-in from (B). (D) B cell follicles (blue) in human spleen from three different donors, CD169+ cells (red) and CD163+ cells (green). (E) zoom-in from first panel of (C).

