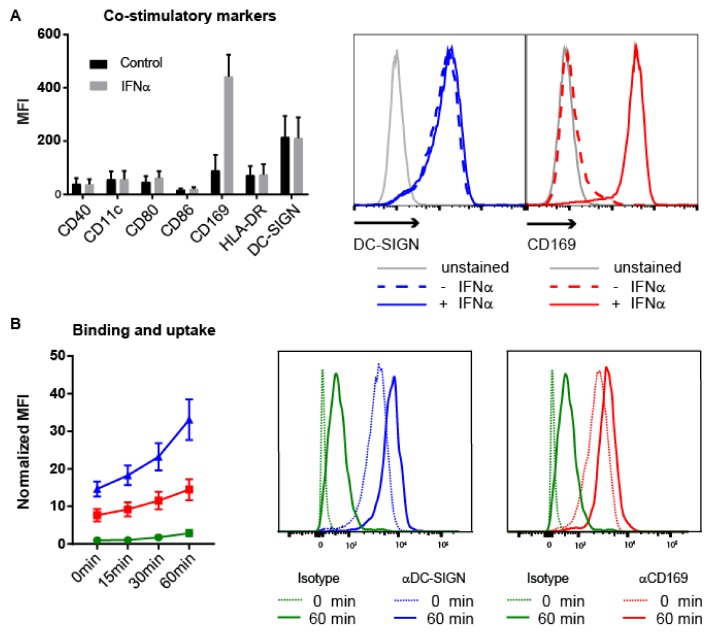
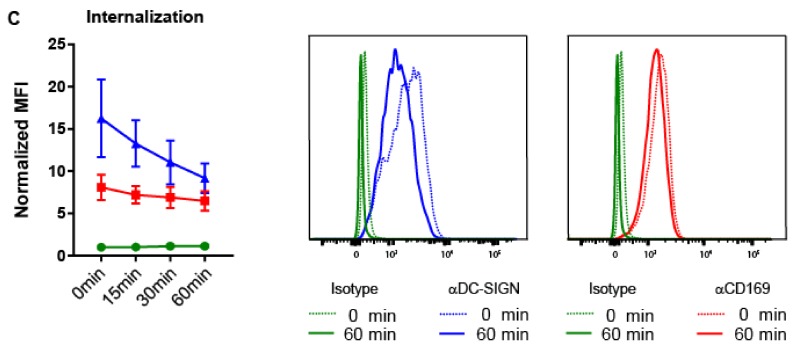
Figure 4.
Expression of CD169 and DC-SIGN on human MoDCs and binding and internalization of Ab-Ag conjugates. (A) Expression of DC maturation markers and CD169 on unstimulated MoDCs (black) or IFNγ stimulated MoDCs (grey) (n = 5). (B) Binding and uptake of specific Abs for CD169 (red), DC-SIGN (blue) and an isotype control (green). Cells were incubated with Abs for 45 min on ice, directly followed by 45 min incubation on ice with a secondary Ab. Subsequently, cells were kept on ice (t = 0 min), or incubated at 37 °C for indicated times and finally analyzed by flow cytometry (n = 4). (C) Receptor internalization after incubation with specific Abs for CD169 (red), DC-SIGN (blue) and an isotype control (green). Cells were incubated with the Abs for 45 min on ice and subsequently washed to remove unbound Ab. Next, cells were kept on ice (t = 0 min) or incubated at 37 °C for indicated times. Receptors remaining on the cell surface were visualized by flow cytometry after incubation with a secondary Ab (n = 3). (A–C) Representative histograms of DC-SIGN (blue, middle panel) and CD169 (red, right panel) expression are shown. (B,C) MFIs are normalized to isotype control at 0 min.


