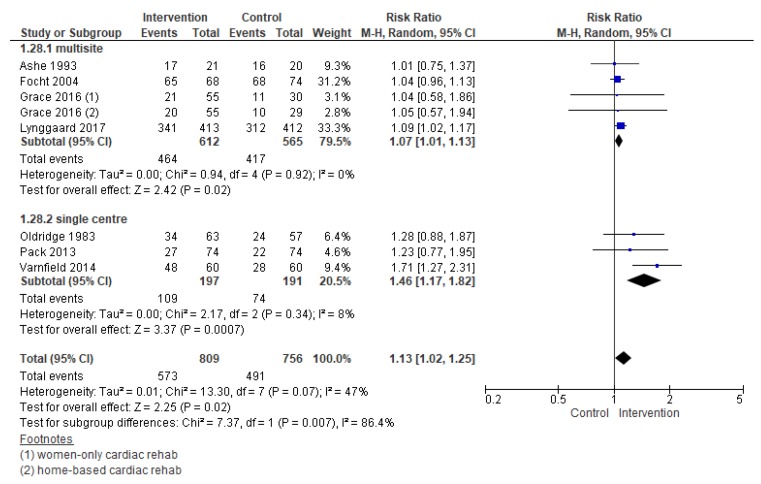
Figure 9.
Forest plot for completion—number of sites. Note: Boxes represent the risk ratio (RR) for individual trials. The boxes are proportional to the weight of each study in the analysis and the lines represent their 95% confidence interval (CI). The diamond represents the pooled RR, and its width represents its 95% CI.

