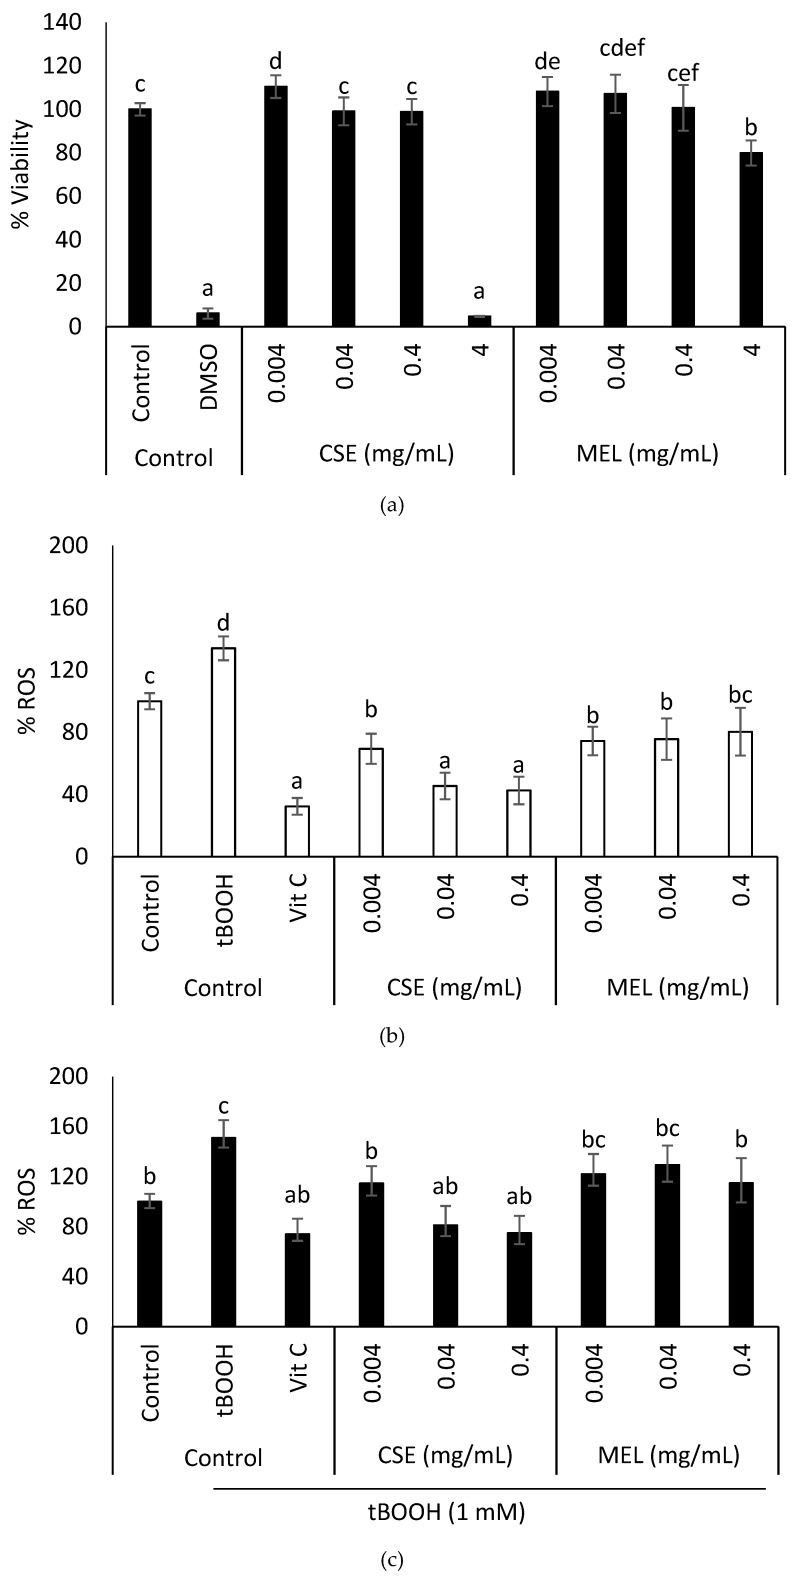
Figure 3.
Effect of CSE and MEL on IEC-6 (a) cell viability, (b) physiological ROS, and (c) induced intracellular ROS. Cells were cultured with different concentrations of CSE or MEL, for 24 h. Then, the MTT assay was performed to determine cell viability and ROS were measured using the DCFH-DA probe. Control—untreated cells; death control—DMSO (50%); oxidation control—tBOOH (1 mM); antioxidant control—vitamin C (10 µg/mL). Data are shown as the mean ± SEM of the three independent experiments. Different letters above columns indicate significant differences among treatments (Tukey test, p ≤ 0.05).

