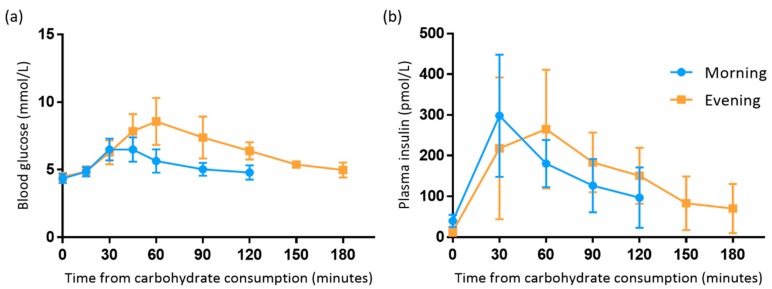
Figure 3.
Postprandial blood glucose (a) and plasma insulin (b) responses following the cellulose treatment in the morning and evening. Data are mean with standard deviation error bars. Paired samples t tests showed significant differences between blood glucose iAUC and peak concentration between morning and evening (p < 0.05).

