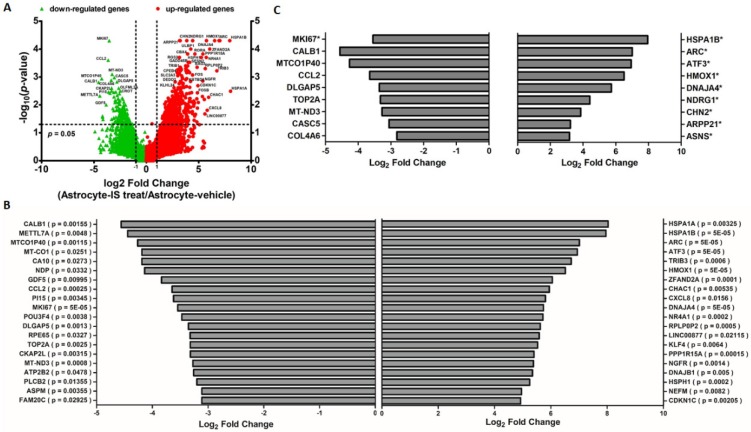
Figure 3.
Display of differential expression patterns of IS-treated and vehicle-treated human astrocyte from deep sequencing. (A) Volcano plot of the RNA sequencing result of differential gene expression in IS and vehicle-treated astrocyte. The x-axis indicates the logarithm to the base 2 of expression fold-change (astrocyte-IS treat/Astrocyte-vehicle), and the y-axis indicates the negative logarithm to the base 10 of the p-values. Red circular marks represent upregulated genes in the Astrocyte-IS treat group, and green triangular marks represent downregulated genes in the Astrocyte-IS treat group. Vertical lines reflect the filtering thresholds of 2.0-fold-change, and horizontal line reflect filtering threshold of p-value = 0.05. A total of 437 significantly upregulated and 191 significantly downregulated genes in IS-treated astrocytes can be identified. (B) Bar graphs display the top 20 upregulated and 20 downregulated genes in IS-treated astrocytes with p-value < 0.05. (C) Bar graphs display the upregulated and downregulated genes in IS-treated astrocytes with a false discovery rate (FDR) adjusted p-value (* indicates FDR-adjusted p-value < 0.05).

