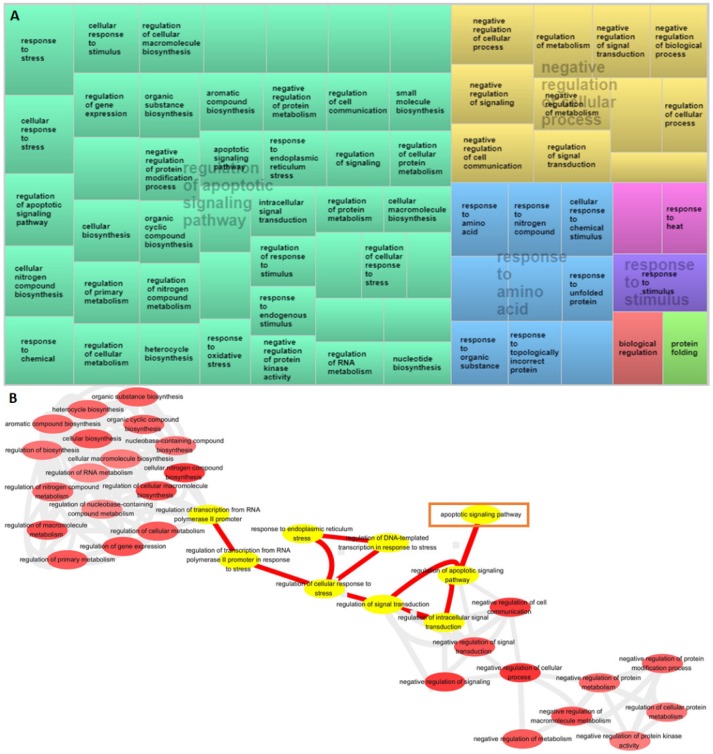
Figure 4.
Gene Ontology (GO) enrichment analysis of differentially expressed genes based on over-representation analysis (ORA). (A) Enrichment of DEGs among biological process category in IS-treated astrocytes. Treemaps of DEGs generated using REVIGO. Each rectangle is a single cluster representative. The representatives are joined into “superclusters” of loosely related terms, visualized with different colors. Similar colors denote semantic similarity, and the dimension of the area is proportional to the overall direction of impact. Sizes of the rectangles reflect either the p-value or the frequency of the GO term in a given cluster. (B) REVIGO interactive graph accessed using Gorilla-summarized gene ontology biological process categories.

