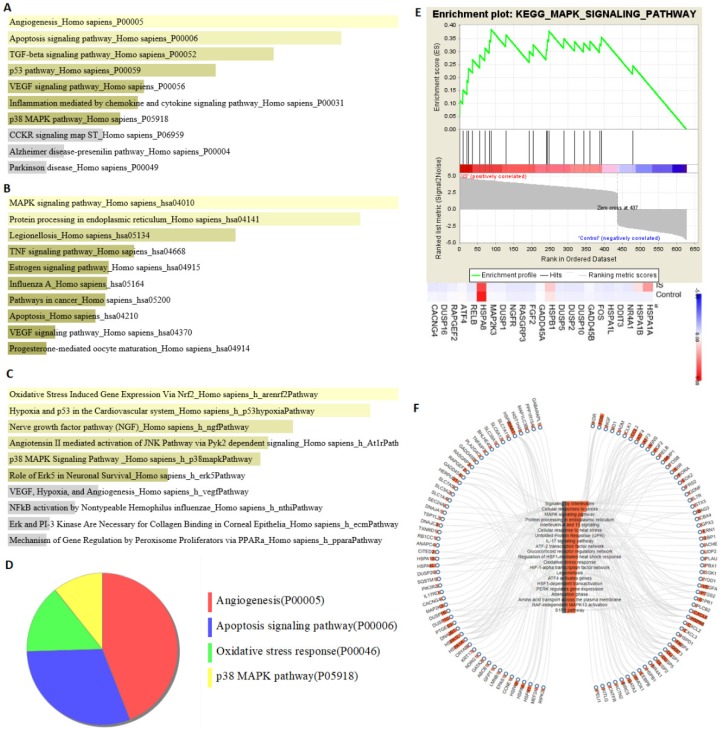
Figure 5.
Pathway enrichment analysis of differentially expressed genes. The results of (A) PANTHER (Protein ANalysis THrough Evolutionary Relationships), (B) KEGG (Kyoto Encyclopedia of Genes and Genomes), and (C) BioCarta pathway enrichment analyses performed using Enrichr method. (D) The major PANTHER pathway identified using the Benjamini–Hochberg false discovery rate (FDR) multiple test correction. (E) The Gene Set Enrichment Analysis (GSEA) result of differentially expressed genes. The 628 differentially expressed genes in IS-treated astrocytes were uploaded into GSEA for enrichment analysis. The KEGG gene sets database was used as the gene set collection for analysis. GSEA performed 1000 permutations. The cutoff for significant gene sets was a false discovery rate <25%. (F) The correlation of KEGG pathway and associated gene expression on IS-treated astrocytes using WebGIVI web-based gene visualization tool. The bar chart on the node represents the frequency of the said node.

