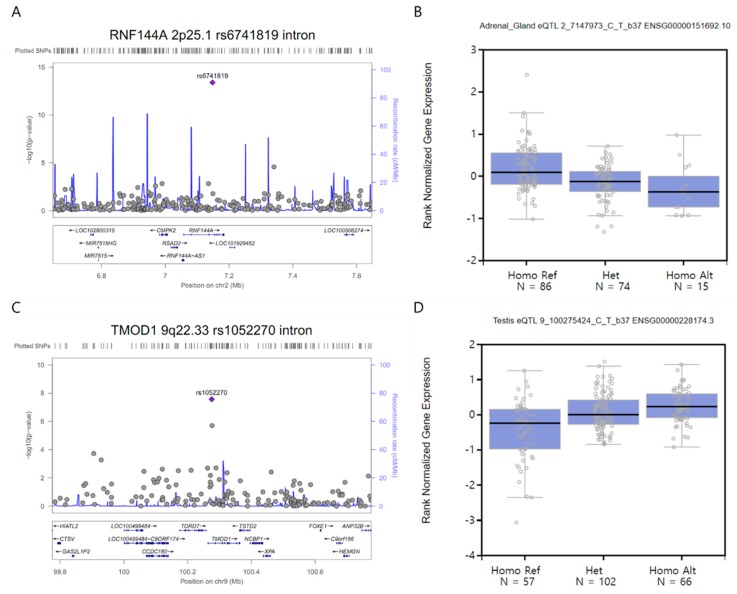
Figure 3.
(A and C) A regional plot of (A) the rs6741819 (intron, RNF144A, 2p25.1) and (C) rs1052270 (intron, TMOD1, 9q22.33) variants (± 500 kb) demonstrates associations with intracranial aneurysms in 250 patients and 294 controls after adjusting for age, sex, hypertension, diabetes, hyperlipidemia, cigarette smoking, and four principal components. The x- and y-axes indicate the chromosomal position (mega base, Mb) and -log10 transformed P-values, respectively. The purple diamonds indicate the rs6741819 and rs1052270 variants with genome-wide associations in our study (p = 4.0 × 10⁻¹⁴ and 2.7 × 10⁻⁸, respectively). The gray circles indicate other SNPs within 500kb of the rs6990241 and rs1052270 variants’ position. (B and D) The expression level of (B) rs6741819 and (D) rs1052270 variants in the adrenal gland (n = 175) and testis (n = 225) tissues, respectively, according to single-cell expression quantitative trait loci (eQTL) in the GTeX portal (https://gtexportal.org/home). The x- and y-axes indicate three genotypes for each variant and the rank-normalized gene expression level, respectively. The Reference (Ref) and Alternative (Alt) alleles of each variant’s genotypes are equal to their major/minor alleles, respectively. Homo, homozygote; Het, heterozygote.

