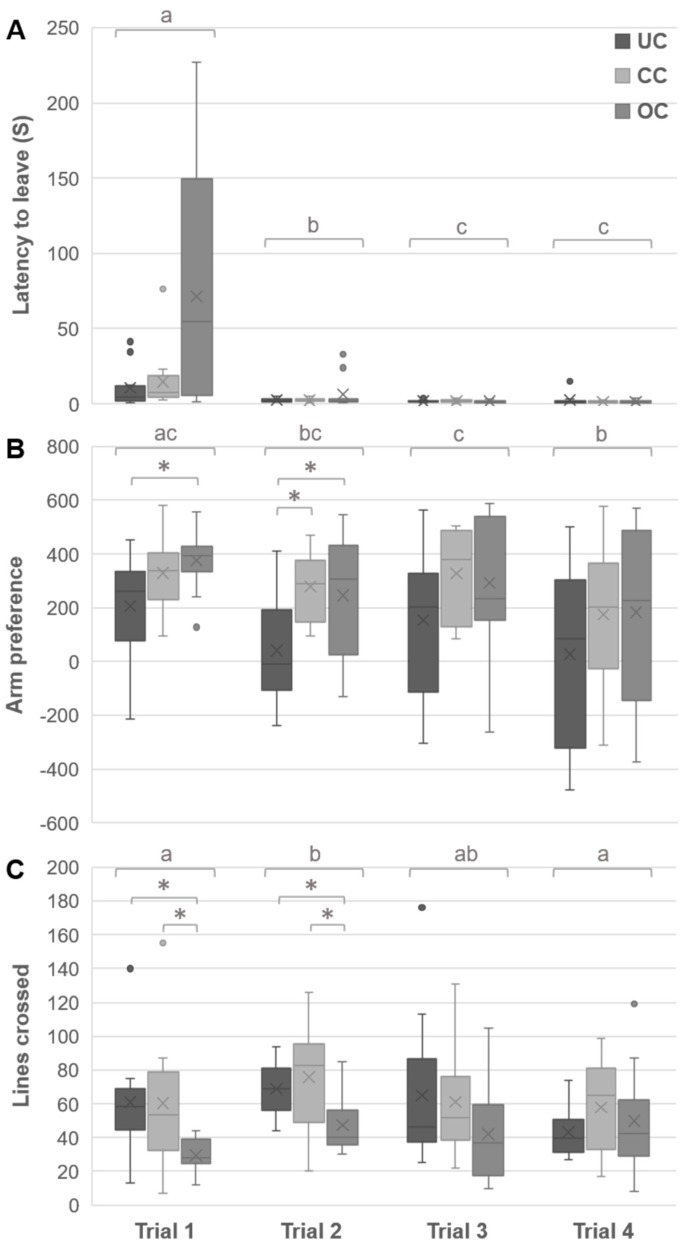
Figure 5.
Effects of housing density on Y-maze behavior. The latency to leave the start-box (A), arm preference; with 0 indicating no preference, a positive value indicating the time spent more in the social arm, and a negative value indicating the time spent more in the foraging arm, in s (B), and number of lines crossed (C) of eight-week old chicks during the Y-maze test are depicted. Letters indicate trial differences across the groups, and asterisk indicate group differences within trials. The box ranges from the first to the third quartile, line indicates the median and cross indicates the mean, whiskers represent minimum and maximum without outliers, * p < 0.05 (UC = undercrowding, CC = conventional crowding, OC = overcrowding condition).

