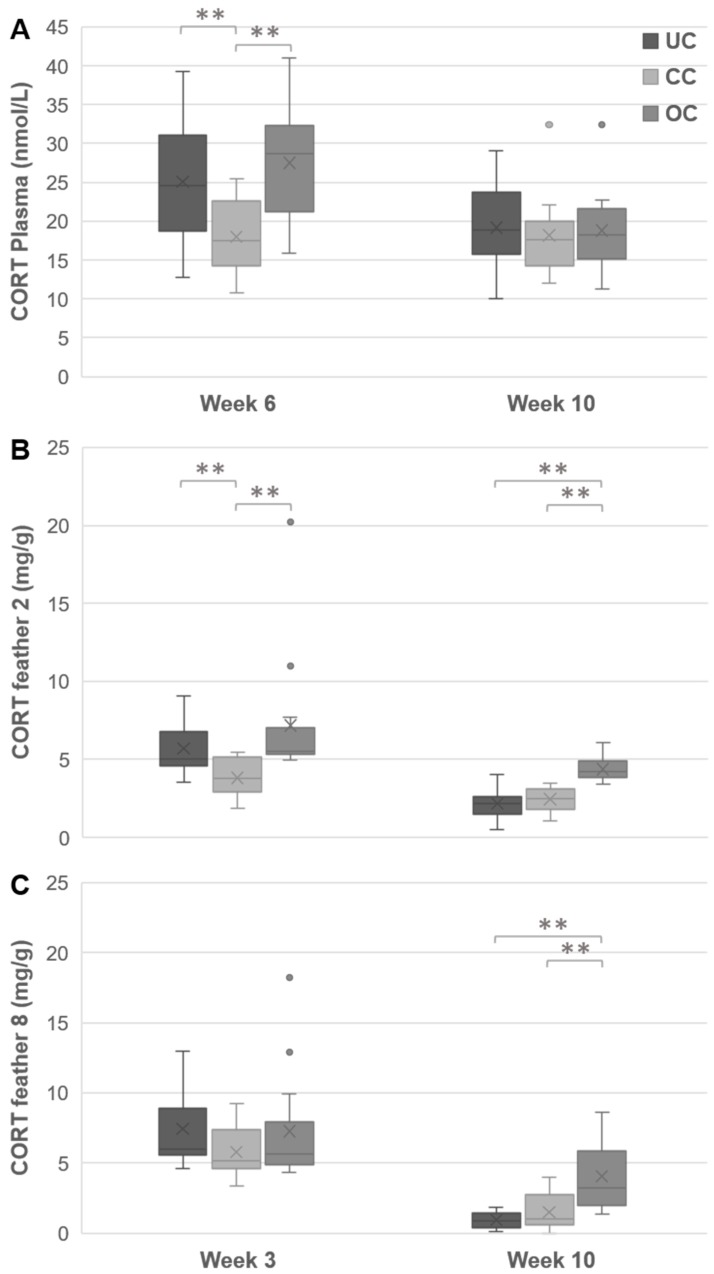
Figure 6.
Effects of housing density on plasma CORT levels. The plasma CORT levels (nmol/L) in chicks aged 6 weeks and 10 weeks (A), CORT deposition (pg/mg) in feather 2 (B) and feather 8 (C) at 3 weeks and 10 weeks of age. The box ranges from the first to the third quartile, line indicates the median and cross indicates the mean, whiskers represent minimum and maximum without outliers, ** p < 0.01 (UC = undercrowding, CC = conventional crowding, OC = overcrowding condition).

