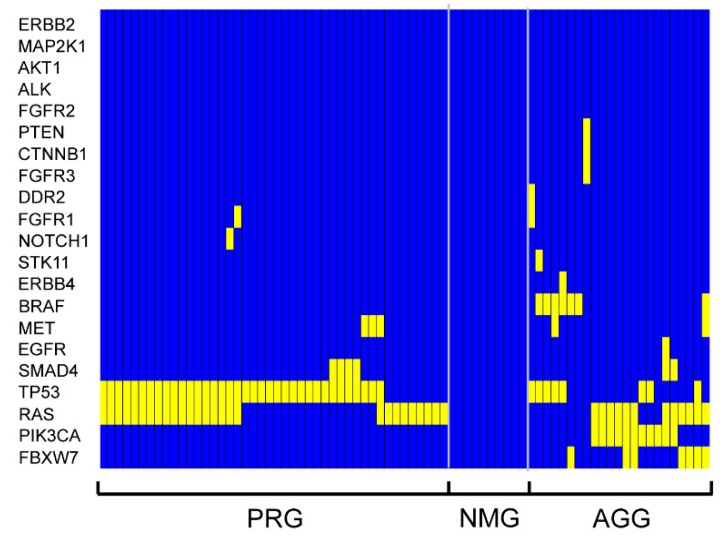
Figure 2.
Heat-map representation of hierarchical clustering analysis of mCRC data. Columns represent the 77 samples of mCRC patients and rows represent the 22 different mutational markers. Three separate clusters were generated by this analysis. Each cluster corresponds to a distinct genetic profile. The color assigned to a cell in the heatmap grid indicates mutational condition (yellow for mutation, blue for wild-type gene) of a particular gene in a given patient sample.

