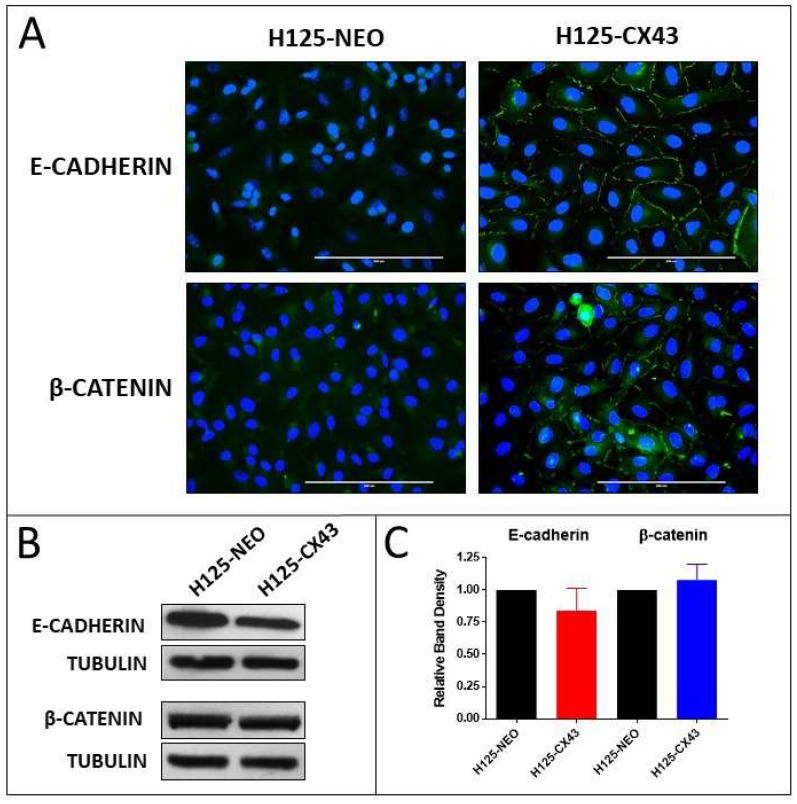
Figure 2.
Localization and expression of E-cadherin and β-catenin in H125 cells. (A) Fluorescent FITC immunostaining of E-cadherin and β-catenin with DAPI staining of nuclei, scale bars: 200 µm; (B) Western blots of E-cadherin and β-catenin and (C) densitometric analysis of band densities normalized to tubulin loading control and to H125-NEO cells (no statistically significant differences; one-sample t-test, mean ± S.D., n = 3 replicate experiments).

