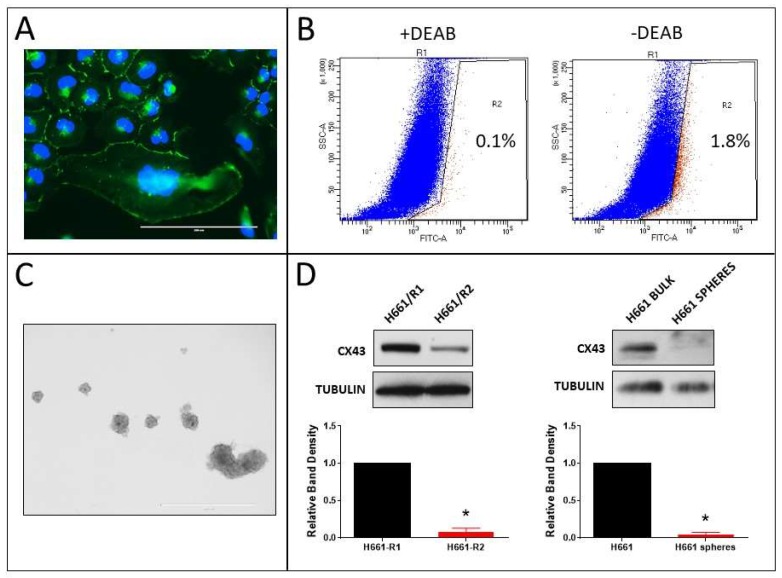
Figure 9.
Expression of Cx43 in ALDH-positive cells and tumorspheres derived from H661 cells. (A) Cx43 immunostaining (scale bar: 200 µm); (B) dot plots of FACS-sorted ALDH-low (R1 pool) and ALDH-high (R2 pool) with and without DEAB (the percentages of R2 cells are shown on the plots); (C) H661 tumorspheres (scale bar: 1000 µm); and (D) Western blots of Cx43 in R1 (ALDH-low) and R2 (ALDH-high) populations (left blots), and bulk cells and tumorspheres (right blots); Cx43 band densities were normalized to tubulin loading control and to R1 or bulk cells (* p < 0.01 compared to R1 or bulk cells, one-sample t-test, mean ± S.D., n = 3 replicate experiments).

