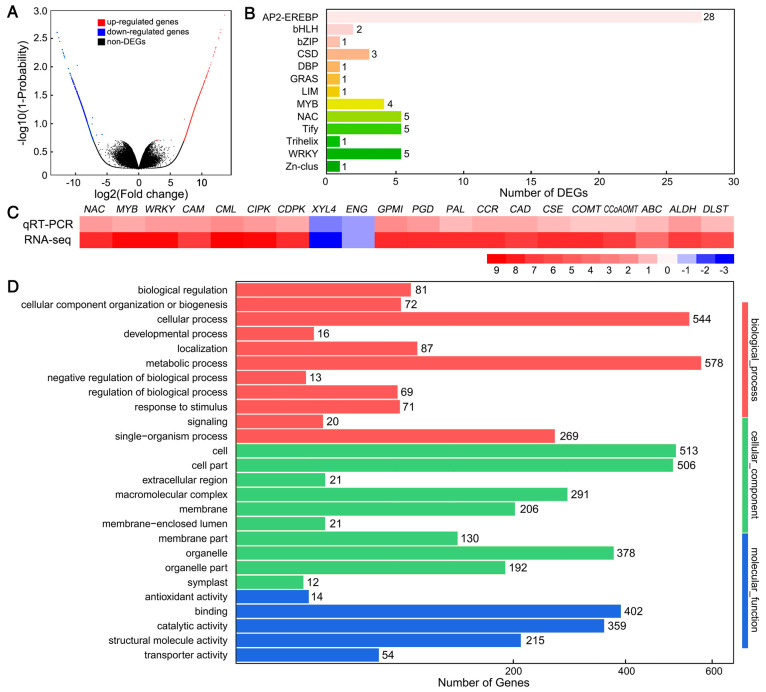
Figure 2.
Effects of nano-CaCO3 treatment on the transcriptome of P. lactiflora inflorescence stems. (A) Volcano plot of differentially expressed genes (DEGs). The X axis represents log2-transformed fold change, the Y axis represents -log10-transformed adjusted p-values, the red points represent upregulated DEGs, the blue points represent downregulated DEGs, and the black points represent non-DEGs. (B) Transcription factor family classification of DEGs. The X axis represents the number of DEGs and the Y axis represents the family of transcription factors. (C) Heat map of the log2 relative expression levels of the expression results for 20 DEGs in nano-CaCO3/Control obtained from RNA-seq and qRT-PCR analysis; CAM, Calmodulin gene; CML, Calmodulin-like protein gene; CIPK, calcineurin B-like protein-interacting protein kinase gene; CDPK, calcium-dependent protein kinase gene; XYL4, xylan 1,4-beta-xylosidase gene; ENG, endoglucanase gene; GPMI, 2,3-bisphosphoglycerate-independent phosphoglycerate mutase gene; PGD, 6-phosphogluconate dehydrogenase gene; PAL, phenylalanine ammonia-lyase gene; CCR, cinnamoyl-CoA reductase gene; CAD, cinnamyl-alcohol dehydrogenase gene; CSE, caffeoyl shikimate esterase gene; COMT, caffeic acid 3-O-methyltransferase gene; CCoAOMT, caffeoyl-CoA 3-O-methyltransferase gene; ABC, ABC transporters; ALDH, Alcohol dehydrogenase; DLST, Dihydrolipoamide succinyltransferase. (D) GO classification of DEGs. The X axis represents the number of DEGs, the Y axis represents the GO terms.

