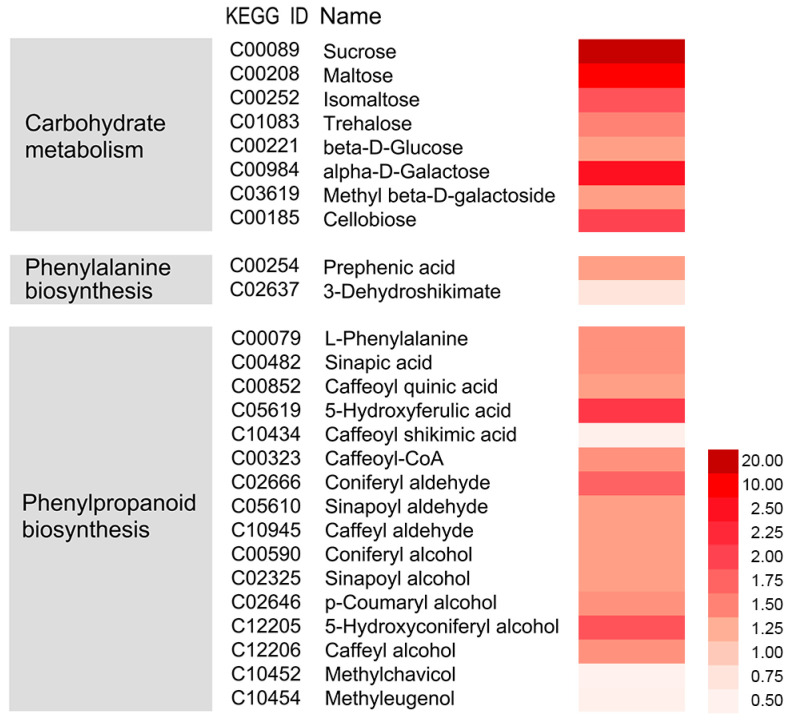
Figure 5.
Effects of nano-CaCO3 treatment on the metabolome of P. lactiflora inflorescence stems. Heat map of log2 relative levels of the main metabolites in nano-CaCO3/Control involved in carbohydrate metabolism, phenylalanine biosynthesis, and phenylpropanoid biosynthesis. The dark red and light red colors indicate increased and decreased metabolites, respectively.

